. 2017 Mar 8;93(5):1094-1109.e7.
doi: 10.1016/j.neuron.2017.01.033. Epub 2017 Feb 23.

Diverse Non-genetic, Allele-Specific Expression Effects Shape Genetic Architecture at the Cellular Level in the Mammalian Brain

Affiliations

Diverse Non-genetic, Allele-Specific Expression Effects Shape Genetic Architecture at the Cellular Level in the Mammalian Brain

Wei-Chao Huang et al. Neuron. .

Abstract

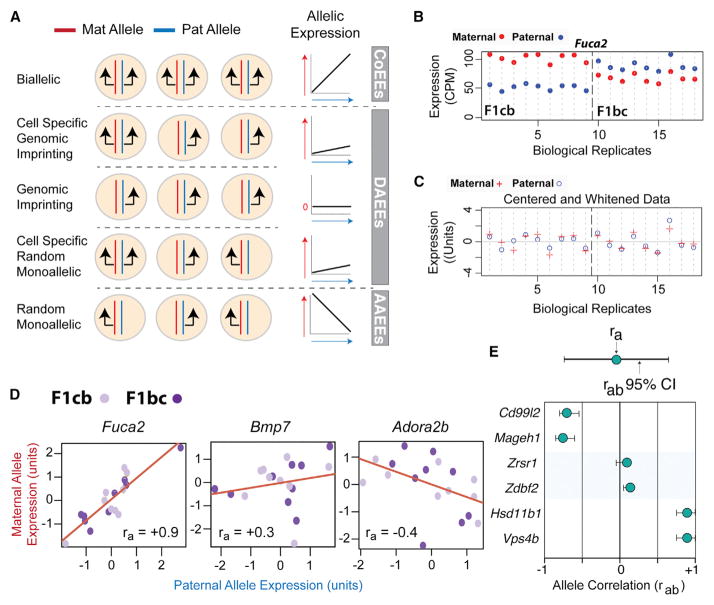
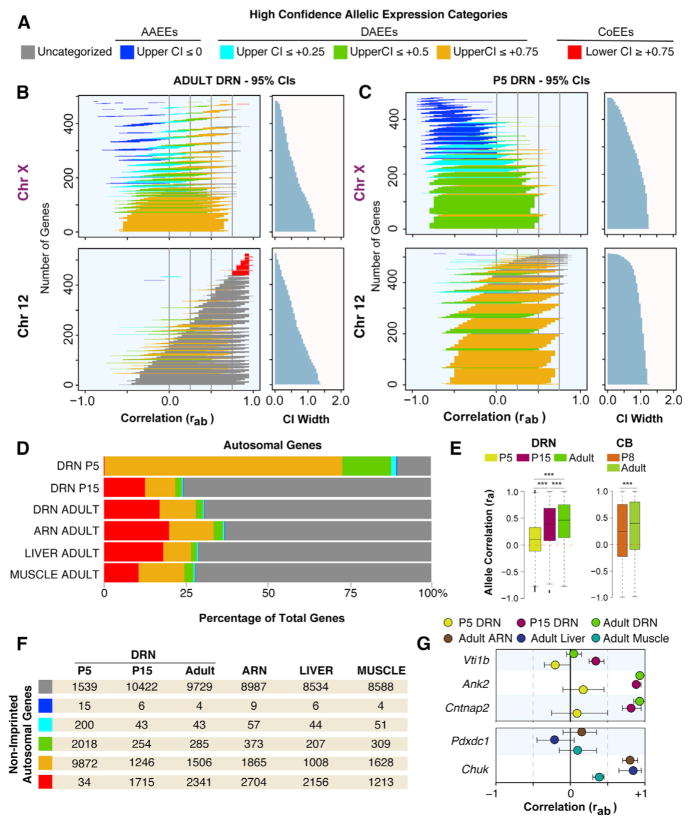
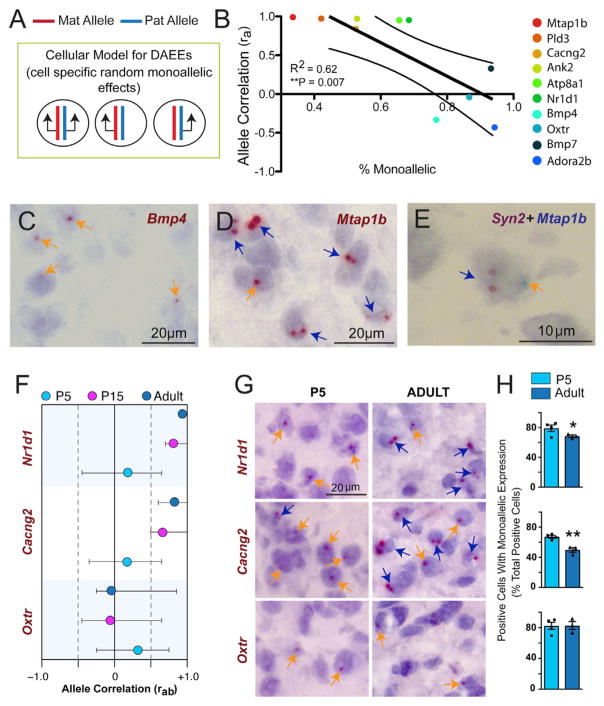
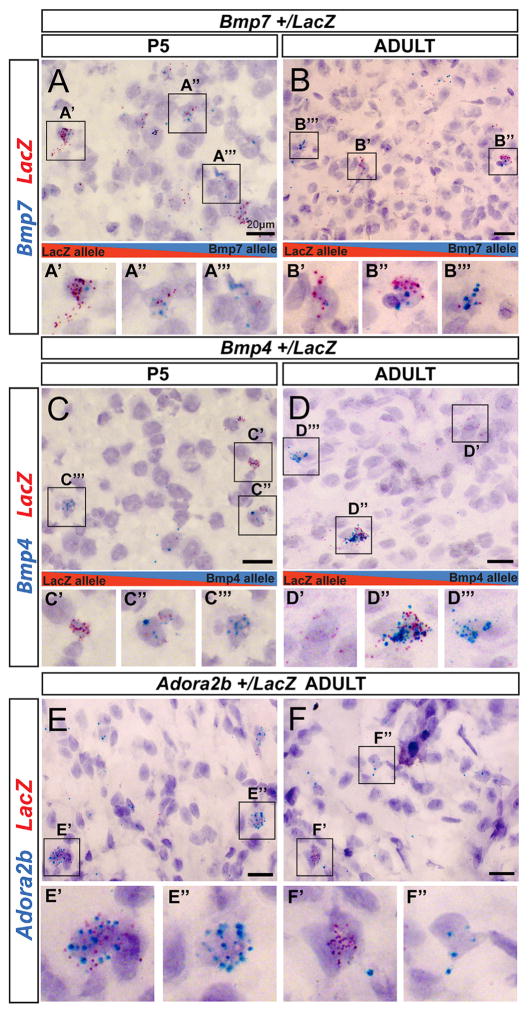
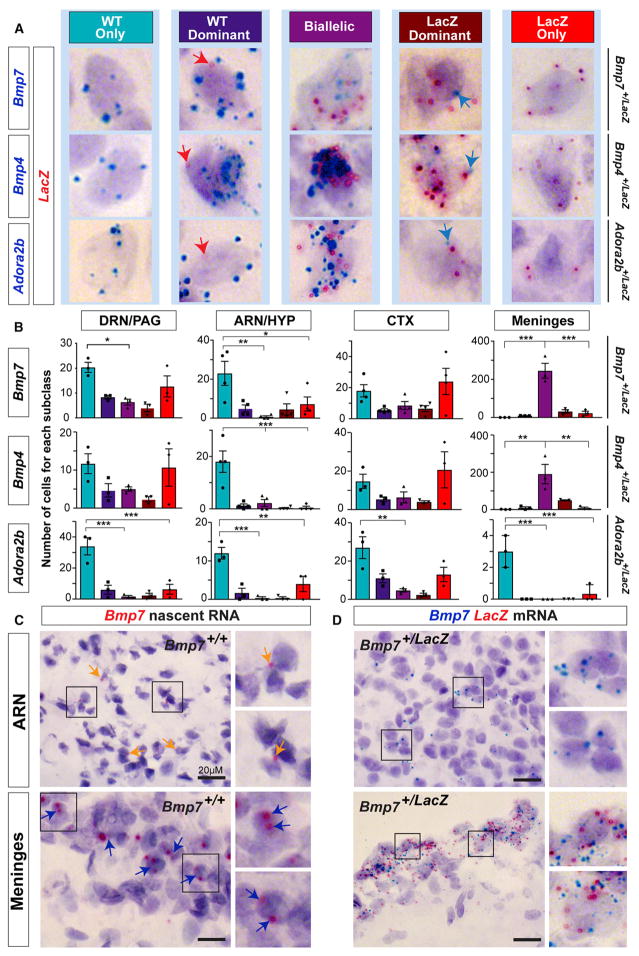
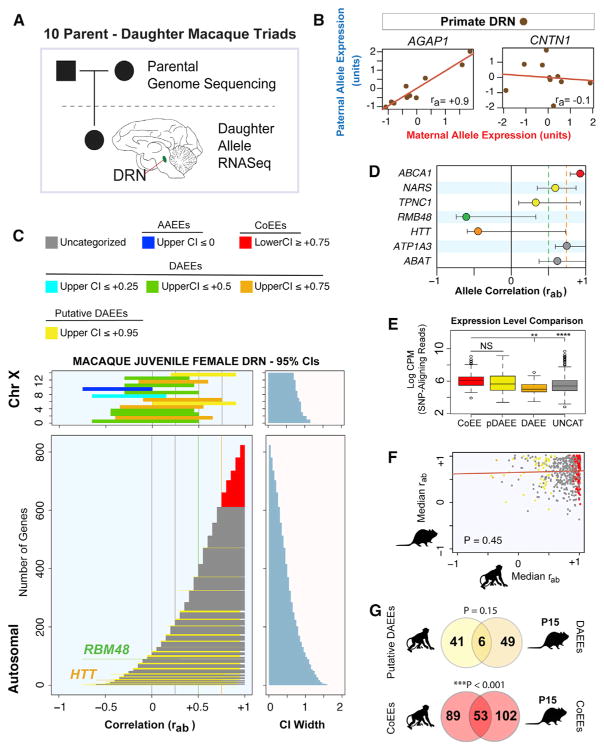
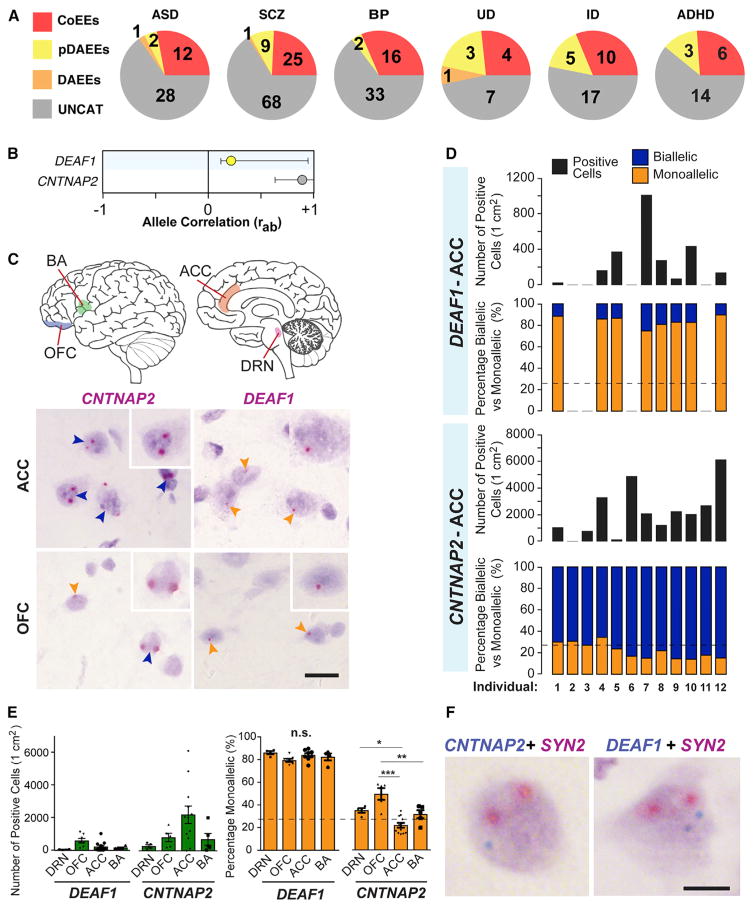
Interactions between genetic and epigenetic effects shape brain function, behavior, and the risk for mental illness. Random X inactivation and genomic imprinting are epigenetic allelic effects that are well known to influence genetic architecture and disease risk. Less is known about the nature, prevalence, and conservation of other potential epigenetic allelic effects in vivo in the mouse and primate brain. Here we devise genomics, in situ hybridization, and mouse genetics strategies to uncover diverse allelic effects in the brain that are not caused by imprinting or genetic variation. We found allelic effects that are developmental stage and cell type specific, that are prevalent in the neonatal brain, and that cause mosaics of monoallelic brain cells that differentially express wild-type and mutant alleles for heterozygous mutations. Finally, we show that diverse non-genetic allelic effects that impact mental illness risk genes exist in the macaque and human brain. Our findings have potential implications for mammalian brain genetics. VIDEO ABSTRACT.

Keywords: allele-specific expression; autism; behavioral genetics; brain development; brain epigenetics; genomic imprinting; mental illness; monoallelic; random monoallelic expression; transcriptome.


Figures

Figure 1
Figure 1. A Genomics and Statistical Approach to Screen for Diverse ASE Effects In Vivo
(A) Schematic of the expected relationship between different allelic effects at the cellular level and maternal and paternal allele-correlated expression patterns at the tissue level. Black arrows indicate the expressed alleles in individual cells. Linear regression line schematics depict the relative expression patterns of the two alleles across replicates (allelic expression), with the red arrow indicating increasing maternal allele expression and the blue arrow indicating increasing paternal allele expression. The slope of the regression line depicts the co-expression relationship between the two alleles. Biallelic expression promotes allele CoEEs, genomic imprinting promotes DAEEs, cell-type-specific genomic imprinting or random monoallelic expression promotes partial DAEEs, and random monoallelic expression in all cells promotes AAEEs (see text). (B and C) Example of maternal (red dot) and paternal (blue dot) allele expression patterns across RNA-seq biological replicates (n = 18) for Fuca2 in the DRN of adult female F1cb and F1bc mice (B). Note the correlated expression of the two alleles despite complex cross and parent-of-origin effects. After centering the F1cb and F1bc RNA-seq data, the variance in the expression levels of the maternal (red plus) and paternal (blue circle) alleles reveals correlated allelic expression patterns (ra = +0.9) (C). (D) RNA-seq analysis of maternal and paternal allele expression correlation (ra) reveals genes with co-expressed alleles (Fuca2), genes with DAEEs (Bmp7), and genes with AAEEs (Adora2b). (E) Schematic of the presentation of the observed ra and estimated rab 95% CI for individual genes. Below are examples of random monoallelic X-linked genes with AAEEs (cd99l2, Mageh1), canonical imprinted genes with DAEEs (Zrsr1, Zdbf2), and autosomal genes with allele CoEEs (Hsd11b1, Vps4b).
Figure 2
Figure 2. In Vivo Screen for ASE Effects in the Mouse Brain at Different Ages and Across Different Adult Tissues Reveals Genes with AAEEs, DAEEs, and Allele CoEEs and an Enrichment for DAEEs in the Neonatal Brain
(A) Criteria for categorizing genes according to AAEEs, DAEEs, and allele CoEEs; CI represents rab 95% confidence interval. (B) Plots of the rab 95% CIs for all chromosome (chr)X and chr12 genes expressed in the adult female DRN reveal high-confidence AAEEs, subcategories of DAEEs, and high-confidence allele CoEEs. Gene CIs are colorized according to the appropriate category (A), and uncategorized genes are indicated in gray. The width of the CIs are presented in the right graph. Most X-linked genes have an upper-bounded 95% CI less than or equal to +0.75, indicating a threshold for ASE effects. Few autosomal genes achieve this strict threshold (see chr12 data). (C) Plots of the rab 95% CIs for all chrX and chr12 genes expressed in the P5 female DRN reveal a substantial shift toward increased DAEEs among autosomal genes. (D) The percentage of all expressed autosomal genes with different allelic effects in the P5, P15, and adult female DRN as well as in the adult female ARN, muscle, and liver. DAEEs are prevalent in the P5 DRN, and allele CoEEs are more prevalent in juvenile and adult tissues. (E) Boxplots of the ra values for all autosomal genes analyzed in the P5, P15, and adult DRN and in the P8 and adult cerebellum (CB). A significant genome-wide developmental change in ASE effects occurs, involving increased DAEEs at P5 and P8 and increased allele co-expression at P15 and in adults. DRN, one-way ANOVA, and Tukey’s HSD post-test were used; CB, two-tailed t test. ***p < 0.001. (F) Number of non-imprinted, autosomal genes in each allelic expression category (see A) for each age and tissue type. (G) Examples of genes with DAEEs at all ages in the DRN (Vti1b) or age-specific DAEEs in the DRN (Ank2, Cntnap2); examples of genes that exhibit DAEEs across different tissue types (Pdxdc1) or in a tissue-specific manner (Chuk).
Figure 3
Figure 3. Genes with DAEEs Exhibit Increased Monoallelic Expression at the Cellular Level in the Brain Compared to Genes with Co-expressed Alleles
(A) Schematic hypothesis indicates that non-imprinted, autosomal genes with DAEEs may exhibit random monoallelic effects in some cells and biallelic expression in others in the brain. (B) For ten randomly selected, non-imprinted autosomal genes with different ra values, allele-specific nascent RNA in situ hybridization analysis was performed in tissue sections of the DRN and in the ventral periaqueductal gray region of the midbrain from adult female B6 mice. The percentage of monoallelic cells from the total number of positive cells (x axis) is plotted as a function of the ra value (y axis) for each gene. Linear regression reveals a significant negative correlation, indicating that genes with lower ra values are associated with more monoallelic brain cells. Approximately 30% of monoallelic cells are false due to partial nuclei from cryosectioning, and therefore the x axis begins at 30%. (C and D) Examples of allelic, nascent RNA in situ hybridization staining in the adult female B6 DRN and ventral periaqueductal gray region. Genes with low ra values, such as Bmp4 (C), predominantly exhibit monoallelic expression at the cellular level (orange arrows), while genes with high ra values, such as Mtap1b (D), predominantly exhibit biallelic expression (blue arrows). (E) Co-labeling of Mtap1b (blue staining) with the biallelic neuron marker gene Syn2 (brown staining) reveals subpopulations of neurons with putative monoallelic Mtap1b and biallelic Syn2 expression. (F–H) Plots of the ra values and rab 95% confidence intervals for two genes that shift from DAEEs at P5 to allele co-expression in the adult DRN (Nr1d1 and Cacng2) and one gene that exhibits DAEEs at P5 and P15 and a trend toward DAEEs in adults (Oxtr) (F). Examples of monoallelic and biallelic cells in the P5 versus adult female B6 DRN and ventral periaqueductal gray region (G). More monoallelic cells are observed in the P5 than the adult for Nr1d1 and Cacng2, but not for Oxtr. Cell counts reveal significantly more monoallelic than biallelic cells in P5 neonates compared to adults for Nr1d1 and Cacng2, but no difference for Oxtr, consistent with rab data for these genes (H). N = 4, Student’s t test, *p < 0.05, **p < 0.01.
Figure 4
Figure 4. DAEEs Cause Mosaics of Brain Cells that Differentially Express Mutant versus Wild-Type Alleles for Inherited Heterozygous Mutations
(A and B) An analysis of the cellular expression of mutant (MT) versus wild-type (WT) alleles in Bmp7+/LacZ knockout-reporter heterozygous mice at P5 (A) and in adults (B) in the DRN and periaqueductal gray region of the midbrain. Semi-quantitative RNAscope in situ hybridization probes targeting the mRNA from the MT LacZ allele (red) versus the WT Bmp7 allele (blue) reveal sub-populations of brain cells that preferentially express the MT allele (A′ and B′) and the WT allele (A‴ and B‴) and biallelic cells that express both alleles (A″ and B″). (C–F) The cellular expression of MT versus WT alleles in Bmp4+/LacZ knockout-reporter heterozygous mice at P5 (C) and in adults (D) and in adult Adora2b+/LacZ mice (E and F). Subpopulations of cells that preferentially express the MT allele (C′, D′, and F′) are present in the brain for each mouse line, as are cells that preferentially express the WT allele (C‴, D‴, E″, and F″) and biallelic cells (C″, D″, and E′).
Figure 5
Figure 5. DAEEs Involve Brain-Region-Specific and Cell-Type-Specific Allele-Silencing Effects that Shape Genetic Architecture in the Brain
(A) RNAscope in situ hybridization labeling for Bmp7, Bmp4, or Adora2b (blue staining) and LacZ (red staining) mRNA in the brain reveals subclasses of positive cells according to the relative allelic expression of the WT or MT LacZ allele in Bmp7+/LacZ, Bmp4+/LacZ, and Adora2b+/LacZ adult female mice. (B) Numbers of monoallelic (WT or MT LacZ allele), dominant-allele biased (WT or MT LacZ allele), and biallelic cells in the DRN-PAG, ARN-HYP, CTX, and meninges in Bmp7+/LacZ, Bmp4+/LacZ, and Adora2b+/LacZ knockin-knockout adult mice. One-way ANOVA with Tukey’s HSD post-test was used; *p < 0.05, **p < 0.01, ***p < 0.001. (C and D) Monoallelic (orange arrows) and biallelic (blue arrows) Bmp7+ cells identified by nascent RNA in situ in the ARN-HYP and in meningial cells in B6 adult female Bmp7+/+ mice (C). Monoallelic and biallelic cells are also detected in the ARN/HYP and meninges, respectively, by mRNA in situ hybridization for Bmp7 (blue) and LacZ (red) in adult Bmp7+/LacZ mice (D).
Figure 6
Figure 6. Identification of Autosomal DAEEs and Allele CoEEs in the Primate Brain
(A) Schematic of the strategy to profile allele co-expression in the DRN region of juvenile female cynomolgus macaques. For ten parent-offspring trios, we performed whole-genome sequencing of the parents and transcriptome sequencing of RNA extracted from the DRN of the daughters. SNPs that distinguish maternal from paternal alleles in the daughters are determined from the parental genomes and RNA-seq datasets. (B) By analyzing ra values for the 838 genes with maternal and paternal allele RNA-seq data in all ten daughters, we defined genes with allele CoEEs (AGAP1) and potential DAEEs (CNTN1) in the juvenile female macaque DRN. (C) Plots of the non-genetic rab 95% CIs for 17 X-linked genes and 821 autosomal genes, colorized according to the categories of high-confidence allelic effects indicated in the legend. Most X-linked genes exhibit AAEEs or DAEEs. Most autosomal genes exhibit allele CoEEs (red) or do not exhibit sufficiently robust allelic effects to be categorized with high confidence (gray); however, high-confidence DAEEs were discovered for RBM48 and HTT. In addition, more modest putative DAEEs were observed for several autosomal genes (see main text). (D) The ra values and non-genetic rab 95% CIs for examples of primate genes with allele CoEEs (ABCA1), putative DAEEs (NARS, TPNC1), high-confidence DAEEs (RBM48, HTT), and uncategorized genes (ATP1A3, ABAT). (E) Boxplots comparing the primate DRN expression level of autosomal and X-linked genes with allele CoEEs, putative DAEEs (pDAEEs), DAEEs, and uncategorized (UNCAT) genes. A significant main effect of gene class was observed (one way ANOVA, p < 0.0001), and a Tukey’s HSD post-test revealed no difference between genes with CoEEs versus putative DAEEs, but genes with CoEEs are expressed at a higher level than genes with DAEEs or uncategorized genes. **p < 0.01, ***p < 0.001. Expression level is based on SNP-aligning reads only. CPM represents counts per million reads. (F) A comparison of the median rab values extracted from the rab 95% CIs for autosomal genes examined for allelic effects in the macaque compared to the values in the mouse for the orthologs. A Spearman rank partial-correlation analysis controlling for expression levels reveals no significant conservation for allelic effects at the gene level between the two species (p = 0.45). (G) Venn diagram indicates that six genes with putative DAEEs in the primate also have DAEEs in the P15 mouse DRN, while 53 genes with allele CoEEs in the primate also have CoEEs in the mouse. The overlap for CoEEs between the species is greater than expected by chance, indicating some conservation of these effects (hypergeometric test p value shown).
Figure 7
Figure 7. DAEEs Impact Genes Linked to Mental Illness in the Macaque and Human Brain
(A) Pie charts of the numbers of mental illness genes found with high-confidence CoEEs, DAEEs, or putative DAEEs in the macaque DRN. Shown are results for genes linked to autism spectrum disorder (ASD), schizophrenia (SCZ), bipolar disorder (BP), intellectual disability (ID), unipolar depression (UD), and attention deficit hyperactivity disorder (ADHD). (B) The primate DRN ra values and non-genetic rab 95% CIs for the autosomal autism genes CNTNAP2 (uncategorized) and DEAF1 (putative DAEEs). (C) Nascent RNA in situ hybridization in four human brain regions was performed for CNTNAP2 (allele CoEEs in macaque and mouse) and DEAF1 (DAEEs in macaque) to determine the proportion of biallelic versus monoallelic cells. Examples of allele expression staining for each gene are shown for the ACC and OFC. CNTNAP2 exhibits biallelic expression (dark blue) in most cells in the human ACC, while DEAF1 exhibits monoallelic expression (orange arrows). In the OFC, CNTNAP2 is predominantly biallelic, but monoallelic cells are observed, and DEAF1 is predominantly monoallelic. OFC represents orbitofrontal CTX; BA represents Broca’s Area; ACC represents anterior cingulate cortex. (D) Analysis of the number of CNTNAP2+ and DEAF1+ cells in 1 cm2 cryosections of the ACC for 12 adult control females and the proportion of biallelic versus monoallelic cells. The results reveal that the total number of Cntnap2+ and Deaf1+ cells per cm2 is highly variable between individuals, but the relative proportion of biallelic versus monoallelic brain cells is highly reproducible and consistent between individuals for each gene. DEAF1 exhibits monoallelic expression in ~80% of positive cells, while CNTNAP2 exhibits biallelic expression in ~70%–85% of positive cells. Dashed line indicates the percentage of cells with potential monoallelic expression due to cryosectioning artifacts. (E) Comparison of the number of positive cells per cm2 and the percentage of positive cells that are monoallelic between four different human brain regions for CNTNAP2 and DEAF1 (N = 5–12 cases per region). CNTNAP2+ cells are most prevalent in the ACC, while DEAF1+ cells are most prevalent in the OFC. The percentage of CNTNAP2+ cells that are monoallelic in the OFC is significantly greater than in the ACC or BA (one-way ANOVA with Tukey’s HSD post-test). Significantly more monoallelic CNTNAP2+ cells were also observed in the DRN than in the ACC. Brain region differences in the percentage of monoallelic DEAF1+ cells were not observed. *p < 0.05, **p < 0.01, ***p < 0.0001. (F) Double-allele-specific in situ hybridization labeling for CNTNAP2 or DEAF1 (blue staining) and the neuron marker control gene SYN2 (red staining) revealed subpopulations of monoallelic CNTNAP2+ neurons that exhibit biallelic SYN2 expression in the human brain. In addition, subpopulations of biallelic DEAF1+ neurons were also identified in the human brain.

References

    1. Abelin ACT, Marinov GK, Williams BA, McCue K, Wold BJ. A ratiometric-based measure of gene co-expression. BMC Bioinformatics. 2014;15:331. - PMC - PubMed
    1. Ahern TH, Krug S, Carr AV, Murray EK, Fitzpatrick E, Bengston L, McCutcheon J, De Vries GJ, Forger NG. Cell death atlas of the postnatal mouse ventral forebrain and hypothalamus: effects of age and sex. J Comp Neurol. 2013;521:2551–2569. - PMC - PubMed
    1. Alarcón M, Abrahams BS, Stone JL, Duvall JA, Perederiy JV, Bomar JM, Sebat J, Wigler M, Martin CL, Ledbetter DH, et al. Linkage, association, and gene-expression analyses identify CNTNAP2 as an autism-susceptibility gene. Am J Hum Genet. 2008;82:150–159. - PMC - PubMed
    1. Amaral DG, Schumann CM, Nordahl CW. Neuroanatomy of autism. Trends Neurosci. 2008;31:137–145. - PubMed
    1. Anders S, Huber W. Differential expression analysis for sequence count data. Genome Biol. 2010;11:R106. - PMC - PubMed

Publication types