. 2017 Mar 6;27(5):638-650.
doi: 10.1016/j.cub.2017.01.047. Epub 2017 Feb 23.

RTN3 Is a Novel Cold-Induced Protein and Mediates Neuroprotective Effects of RBM3

Affiliations

RTN3 Is a Novel Cold-Induced Protein and Mediates Neuroprotective Effects of RBM3

Amandine Bastide et al. Curr Biol. .

Abstract

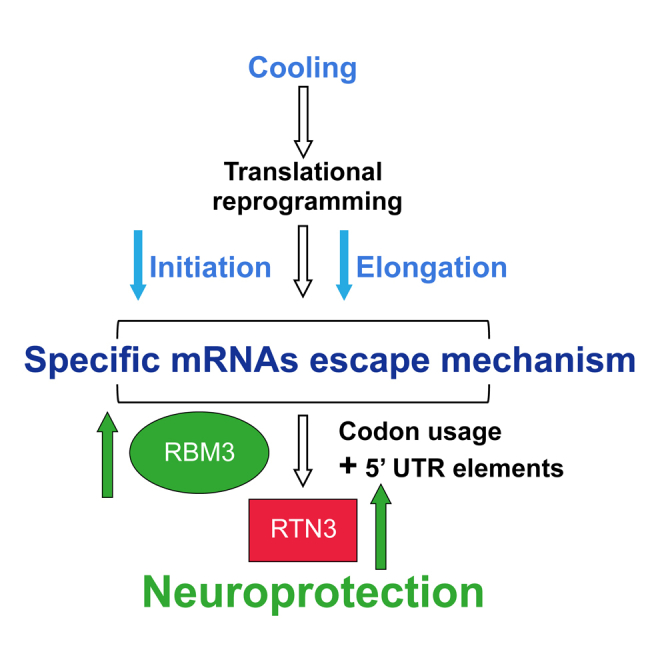
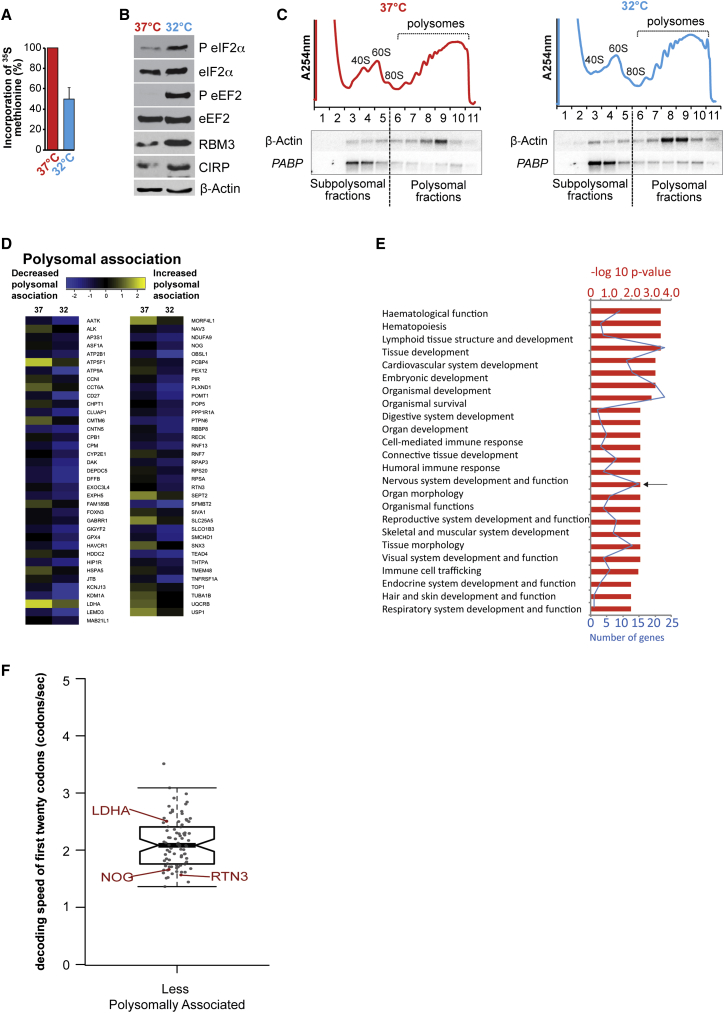
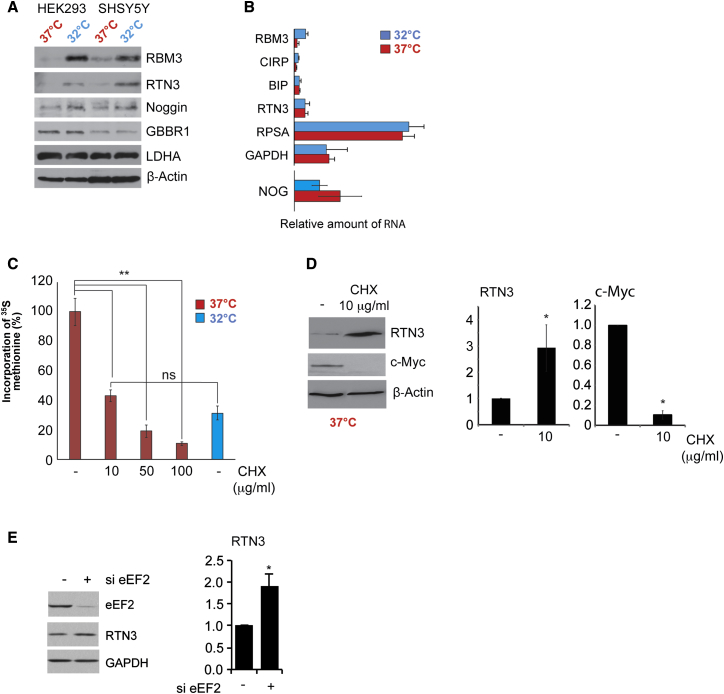
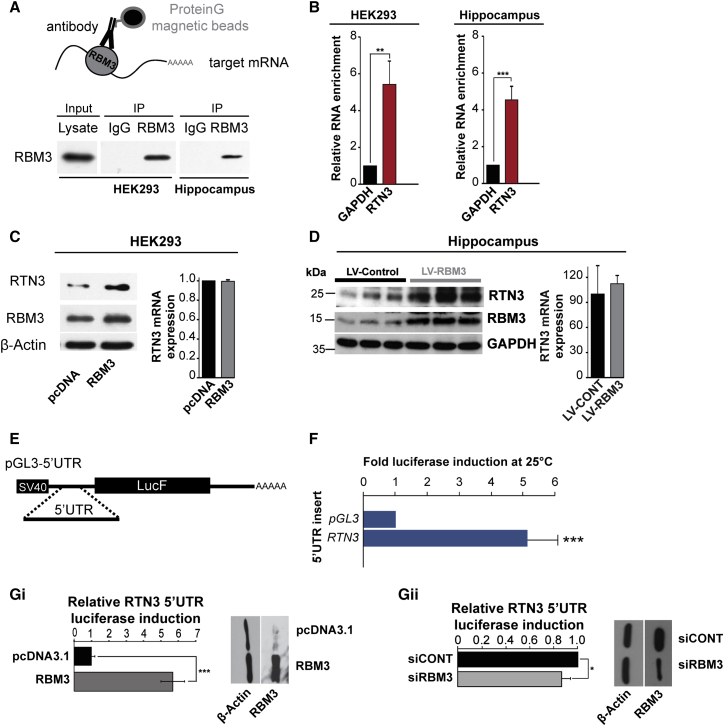
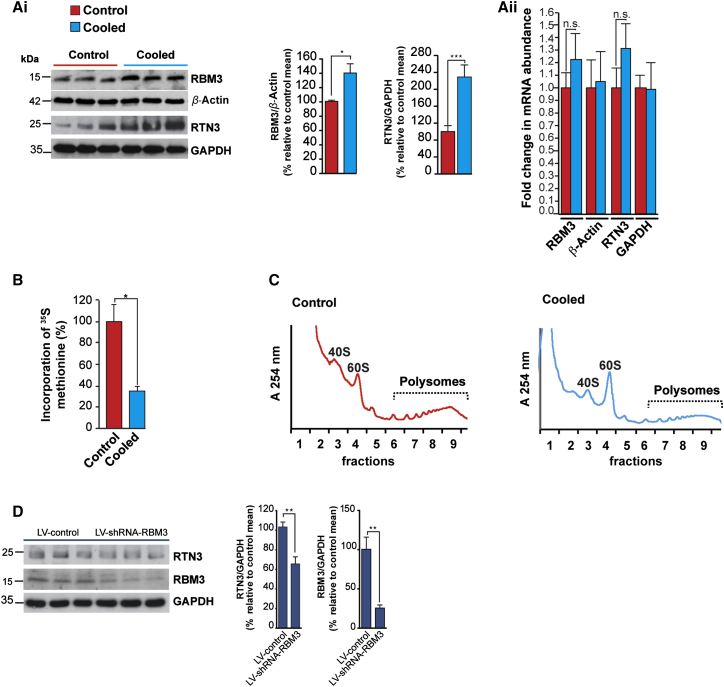
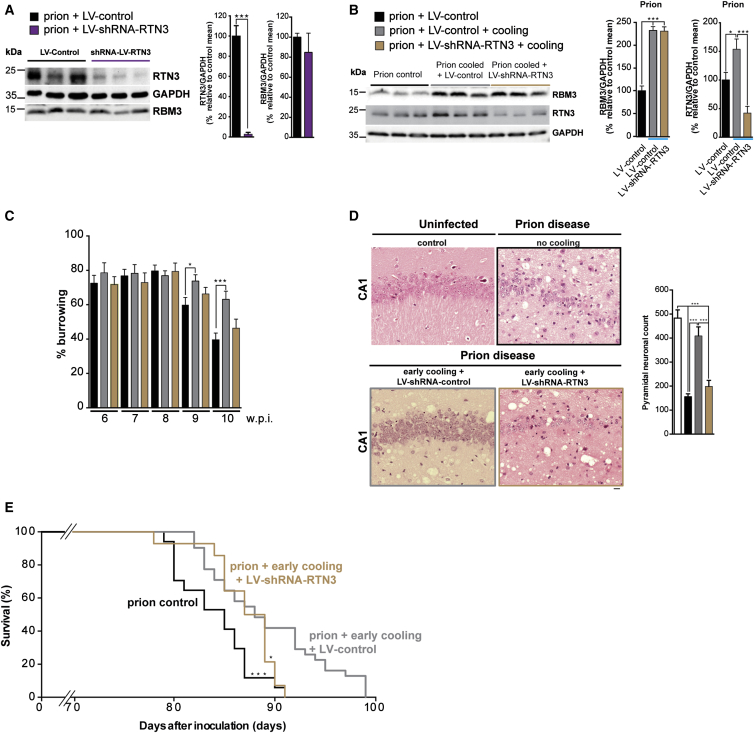
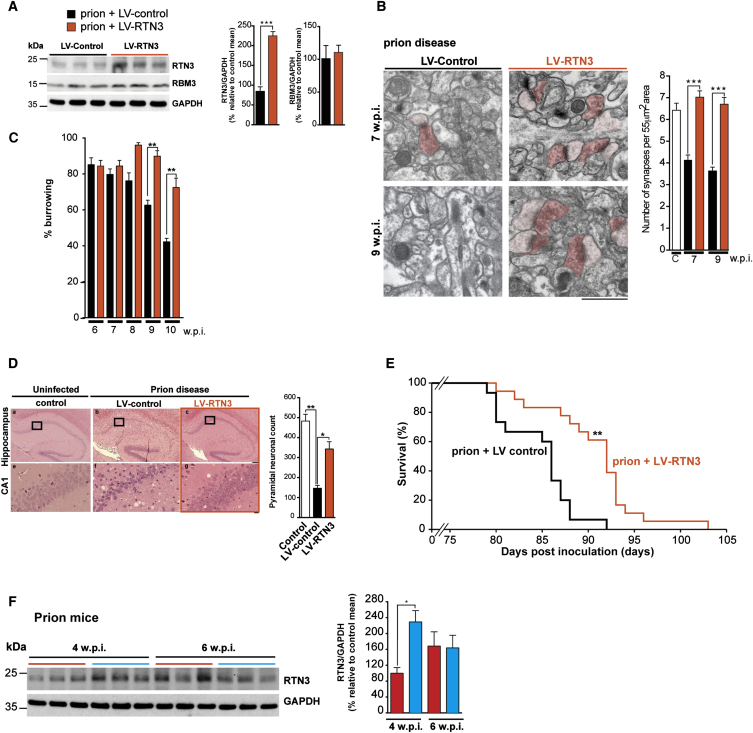
Cooling and hypothermia are profoundly neuroprotective, mediated, at least in part, by the cold shock protein, RBM3. However, the neuroprotective effector proteins induced by RBM3 and the mechanisms by which mRNAs encoding cold shock proteins escape cooling-induced translational repression are unknown. Here, we show that cooling induces reprogramming of the translatome, including the upregulation of a new cold shock protein, RTN3, a reticulon protein implicated in synapse formation. We report that this has two mechanistic components. Thus, RTN3 both evades cooling-induced translational elongation repression and is also bound by RBM3, which drives the increased expression of RTN3. In mice, knockdown of RTN3 expression eliminated cooling-induced neuroprotection. However, lentivirally mediated RTN3 overexpression prevented synaptic loss and cognitive deficits in a mouse model of neurodegeneration, downstream and independently of RBM3. We conclude that RTN3 expression is a mediator of RBM3-induced neuroprotection, controlled by novel mechanisms of escape from translational inhibition on cooling.

Keywords: RBM3; RTN3; cold shock; mRNA translation; neuroprotection; protein synthesis.


Figures

None
Graphical abstract
Figure 1
Figure 1
Mild Cooling Results in Translation Regulation of a Defined Set of Transcripts (A) Protein synthesis rates determined by [35S]-methionine label incorporation after 24 hr incubation of HEK293 cells at 32°C. Values were normalized to cells incubated at 37°C. Error bars represent SE within three independent experiments. (B) HEK293 cells were incubated at 37°C or at 32°C for 24 hr and immunoblotted for RBM3 and CIRP, eIF2 alpha eEF2, and β-actin. (C) Sucrose density gradient ultracentrifugations were performed from HEK293 cells incubated at 37°C or 32°C for 24 hr. Plots show the distribution of RNA within subpolysomes (40S, 60S, and 80S) and polysomes. Northern analysis was carried out on individual fractions, which were probed for β-actin or PABP. (D) mRNAs from gradient fractions were pooled and subjected to cDNA microarray. The color scale represents the ratio of mRNA in subpolysome and polysome fractions, normalized log2 (polysome/subpolysome) value; yellow is polysome- and blue subpolysome-associated mRNAs. (E) mRNAs that showed significant change in polysome/subpolysome (P/S) ratio on cooling were clustered into functional groups. Biological functions associated with decreased polysomal-associated transcripts, obtained from the ingenuity pathways analysis. Fisher’s exact test was used to calculate a p value (threshold p < 0.05) for each biological function represented in the red bar chart. The blue line represents number of proteins per category. (F) Predictive modeling of transcript-decoding speed was performed on the initial 20 codons of human transcript sequences from those that showed decreased polysomal association. The boxplot shows mRNAs that have a decrease in polysomal association and contain an initial 20 “slow” codons (e.g., RTN3 and Noggin [NOG]) compared to those that contain “fast” codons, such as LDHA. See also Figures S1–S3 and Tables S1–S6.
Figure 2
Figure 2
RTN3 Is Subject to Elongation Control (A) Extracts from control or cooled HEK293 or SHSY5Y cells were immunoblotted for RTN3 and Noggin, GBBR1, and LDHA. β-actin is used as a loading control. (B) qRT-PCR was performed on corresponding transcripts. Error bars represent 1 SD from the mean within three independent experiments. GAPDH was used as a control. (C) Protein synthesis rates determined by [35S]-methionine label incorporation after 24 hr incubation of HEK293 cells at 37°C with cycloheximide. Values were normalized to untreated cells. A two-tailed paired Student’s t test was used to calculate statistical significance. Error bars represent SE within three independent experiments. ∗∗p < 0.001, all three conditions. (D) Extracts from cells exposed to 10 μg/mL cycloheximide at 37°C were immunoblotted for RTN3, c-Myc, and β-actin. Error bars represent 1 SD from the mean within three independent experiments. p < 0.01. (E) eEF2 expression was reduced by siRNA, proteins extracted and immunoblotted with the antibodies shown. GAPDH was used as a loading control. Error bars represent 1 SD from the mean within three independent experiments. p < 0.01. See also Figures S4 and S5A.
Figure 3
Figure 3
RTN3 Expression Is Downstream of RBM3 (A) Schematic representation of an RNA immunoprecipitation (RNA-IP) assay. Immunoblots of input lysate from HEK293 cells or hippocampus, immunoprecipitated with either rabbit IgG or RBM3 antibody, are shown. (B) qRT-PCR was performed on RNA-IP samples using primers specific for human (HEK293) or mouse (hippocampus) samples. All values are normalized with respect to the initial RNA input material, and the enrichment is plotted relative to GAPDH. A two-tailed paired Student’s t test was used to calculate statistical significance. Error bars represent 1 SD from the mean within three independent experiments. ∗∗p < 0.01; ∗∗∗p < 0.001. (C) HEK293 cells were transfected with an expression plasmid construct encoding RBM3 or a control plasmid, and extracts were immunoblotted for RTN3. β-actin was used as a loading control. RNA expression of RTN3 was assessed by qRT-PCR. (D) Mouse hippocampi stereotaxically injected with lentivirus containing a construct to overexpress RBM3 and extracts were immunoblotted for RTN3 and GAPDH. qRT-PCR was used to assess the expression of RTN3. (E) Schematic representation of the RTN3 containing plasmid constructs encoding firefly luciferase. (F) HEK293 cells were transfected with construct containing the 5′ UTR of RTN3 and a Renilla luciferase control and incubated at either 37°C or 25°C for 24 hr. Firefly luciferase activity was calculated relative to Renilla luciferase for each condition and expressed as the fold induction from 37°C to 25°C. (Gi) HEK293 cells were transfected with either control (pcDNA3.1) or RBM3 expression plasmid (pcDNA-RBM3) and then transfected with either RTN3 5′ UTR pGL3 or pGL3 and Renilla luciferase constructs and luciferase activity determined. A two-tailed paired Student’s t test was used to calculate error. Error bars represent 1 SD from the mean within three independent experiments. ∗∗∗p < 0.001. (Gii) HEK293 cells were transfected with either control siRNA (siCONT) or RBM3 siRNA (siRBM3) and then transfected with pGL3 and Renilla luciferase constructs. The fold repression from RTN3 5′ UTR pGL3 compared to the control pGL3 was calculated and normalized to siCONT transfection. A two-tailed paired Student’s t test was used to calculate statistical significance. Error bars represent 1 SD from the mean within three independent experiments. p < 0.05; ∗∗p < 0.01; ∗∗∗p < 0.001.
Figure 4
Figure 4
RBM3 Regulates RTN3 In Vivo (Ai) Cooling increases RBM3 and RTN3 levels in hippocampi of wild-type mice. Representative western blots are shown. Bar graphs show quantification of RBM3 and RTN3 levels relative to β-actin and GAPDH, respectively. n = 5 control and 5 cooled mice for RBM3. n = 9 control mice and 9 cooled mice for RTN3. p < 0.05; ∗∗∗p < 0.001 (Aii) qRT-PCR of RNA isolated from hippocampi of cooled mice showed no significant change in the abundance of RBM3 or RTN3 mRNAs following cooling. (B) Protein synthesis rates were determined by 35S methionine incorporation into nascent protein using ex vivo hippocampus slices from cooled mice and control mice. A two-tailed paired Student’s t test was used to calculate statistical significance. Error bars represent 1 SD from the mean within three independent experiments. p < 0.05. (C) Sucrose density gradient ultracentrifugation performed of cytoplasmic extracts from hippocampi from control and cooled mice. Absorbance plots show the distribution of RNA within subpolysomes (40S, 60S, and 80S) and polysomes. (D) RTN3 induction on in vivo cooling is dependent on RBM3 protein expression. Knockdown of RBM3 resulted in a 38% decrease in RTN3 induction. n = 6 LV-control and 6 LV-shRNA-RBM3 mice. ∗∗p < 0.01.
Figure 5
Figure 5
Lentiviral-Mediated Downregulation of Endogenous RTN3 Prevents Cooling-Induced RBM3-Mediated Neuroprotection (A) LV-shRNA-RTN3 injected into hippocampi of prion-infected mice significantly reduces RTN3 protein levels compared to control shRNA (LV-shCONT). n = 6 prion+LV-control mice and 6 prion+LV-shRNA-RTN3 mice. Representative western blots and bar graphs quantification are shown. (B) Western blot of RBM3 in LV-shRNA-RTN3-treated early-cooled prion mice shows no change in expression. n = 6 mice per experimental condition. (C) The early-cooling-induced protection in burrowing behavior declines in LV-shRNA-RTN3 mice. Food pellet remaining in the tube measured after 2 hr is expressed in percentage burrowed. Graph bar with prion (black bars; n = 12 mice), prion + early cooling (gray bars; n = 20 mice), and prion + early cooling + LV-shRNA-RTN3 (light brown bars; n = 12 mice) is shown. One-way ANOVA with Tukey’s post-test was used for multiple comparisons. p < 0.05; ∗∗∗p < 0005. (D) Representative images of H&E-stained hippocampal sections from uninfected control (top left-hand panel), prion-infected mice (top right-hand panel), prion-infected mice treated with early cooling and LV-control (bottom left-hand panel), and prion-infected mice treated with early cooling and LV-shRNA-RTN3 (bottom right-hand panel). Prion-infected mice show extensive neuronal loss, with associated spongiosis, whereas early cooling treatment prevents neurodegeneration. This protection is abrogated with LV-shRNA-RTN3. The graph bar shows quantification of the average number of neurons for each condition in the CA1 area of hippocampus. n = 3 mice (white bar), 7 mice (black bar), 7 prion mice (bar), and 9 mice (light brown bar). One-way ANOVA and Brown-Forsythe test with Tukey’s post hoc analysis for multiple comparisons were used. ∗∗∗p < 0.001. The scale bar represents 50 μm. (E) Early cooling prolongs survival in prion-infected mice but is abolished by knockdown of RTN3. Kaplan-Meier plot; n = 25 cooled mice (gray line); n = 17 not cooled (black line); n = 14 cooled + shRNA of RTN3 (light brown line). One-way ANOVA with Tukey’s post-test was used for multiple comparisons; not cooled versus cooled mice ∗∗∗p < 0.001; not cooled versus cooled + shRNA of RTN3 n.s.; cooled mice versus cooled + shRNA of RTN3 p < 0.05. See also Figures 5C and 5D.
Figure 6
Figure 6
Enhanced RTN3 Expression Is Sufficient to Protect against Prion Disease in the Absence of Cooling (A) LV-RTN3 delivery to hippocampi of prion-infected mice increases RTN3 in the absence of cooling compared to control lentiviral treatment (LV-control) and endogenous RBM3 (remain constant). n = 6 mice LV-control and 6 mice LV-shRNA-RTN3. Representative western blots and bar graphs quantification are shown. (B) LV-RTN3 protected the deficit in synapse loss in prion-infected mice at 7 and 9 w.p.i. Representative electron micrographs are shown, pseudo-colored for ease of synapse identification: presynaptic, dark pink; postsynaptic, light pink. Bar chart quantification is shown. n = 93 images from three animals per condition. Data represent mean ± SEM; t test; ∗∗∗p < 0.0001. The scale bar represents 1 μm. (C) RTN3 overexpression prevented the decline in burrowing behavior of prion–infected mice. Food pellets remaining in the tube were measured after 2 hr and are expressed as percentage burrowed. Graph bar with prion (black bars; n = 14 mice) and prion + LV-RTN3 (orange bars; n = 20 mice) is shown. Kruskal-Wallis test with Dunn’s multiple comparisons test; ∗∗p < 0.01. (D) Representative images of H&E-stained hippocampal sections from uninfected control, prion-infected mice with LV-control, and prion-infected mice with LV-RTN3. The graph bar shows quantification of the average number of neurons for each condition in the CA1 area of hippocampus. n = 3 mice (white bar), 5 mice (black bar), and 15 mice (orange bar). One-way ANOVA and Brown-Forsythe test with Tukey’s post hoc analysis for multiple comparisons were used. ∗∗∗p < 0.001. The scale bars represent 400 μm (top row) and 50 μm (bottom row). (E) LV-RTN3 significantly lengthened survival of prion-infected mice. Kaplan-Meier plot (orange; n = 18) compared to LV-control prion-infected mice (black; n = 15); t test; ∗∗p < 0.01. (F) Induction of RTN3 fails at 6 w.p.i. in prion-diseased mice. Blue lines above the western blots are samples from cooled mice, whereas red lines denote control mice. Bar graphs show quantification of RTN3 levels relative to GAPDH at 4 and 6 w.p.i. prion disease, blue bars represent quantification from cooled mice, and red bars from control mice. n = 9 mice per condition. p < 0.05. Data are mean ± SEM.

Comment in

References

    1. Delhaye C., Mahmoudi M., Waksman R. Hypothermia therapy: neurological and cardiac benefits. J. Am. Coll. Cardiol. 2012;59:197–210. - PubMed
    1. Yenari M.A., Han H.S. Neuroprotective mechanisms of hypothermia in brain ischaemia. Nat. Rev. Neurosci. 2012;13:267–278. - PubMed
    1. Peretti D., Bastide A., Radford H., Verity N., Molloy C., Martin M.G., Moreno J.A., Steinert J.R., Smith T., Dinsdale D. RBM3 mediates structural plasticity and protective effects of cooling in neurodegeneration. Nature. 2015;518:236–239. - PMC - PubMed
    1. Wellmann S., Bührer C., Moderegger E., Zelmer A., Kirschner R., Koehne P., Fujita J., Seeger K. Oxygen-regulated expression of the RNA-binding proteins RBM3 and CIRP by a HIF-1-independent mechanism. J. Cell Sci. 2004;117:1785–1794. - PubMed
    1. Fedorov V.B., Goropashnaya A.V., Tøien O., Stewart N.C., Chang C., Wang H., Yan J., Showe L.C., Showe M.K., Barnes B.M. Modulation of gene expression in heart and liver of hibernating black bears (Ursus americanus) BMC Genomics. 2011;12:171. - PMC - PubMed

LinkOut - more resources