

Nasopharyngeal Protein Biomarkers of Acute Respiratory Virus Infection
- PMID: 28238698
- PMCID: PMC5360578
- DOI: 10.1016/j.ebiom.2017.02.015
Nasopharyngeal Protein Biomarkers of Acute Respiratory Virus Infection
Abstract
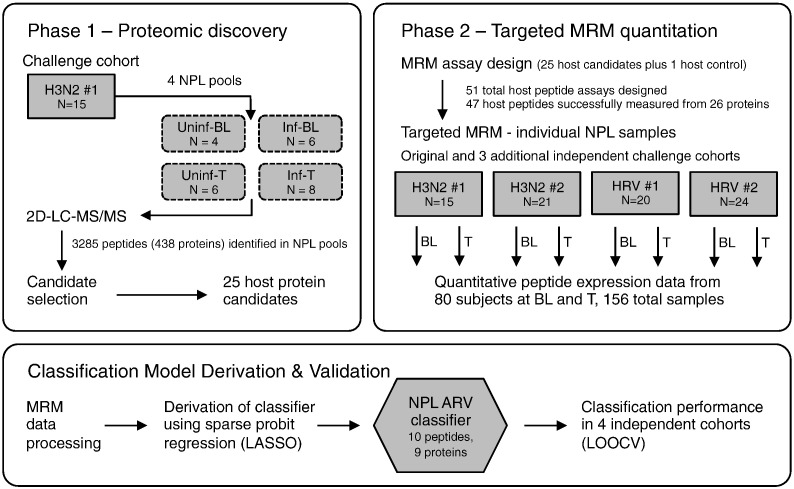
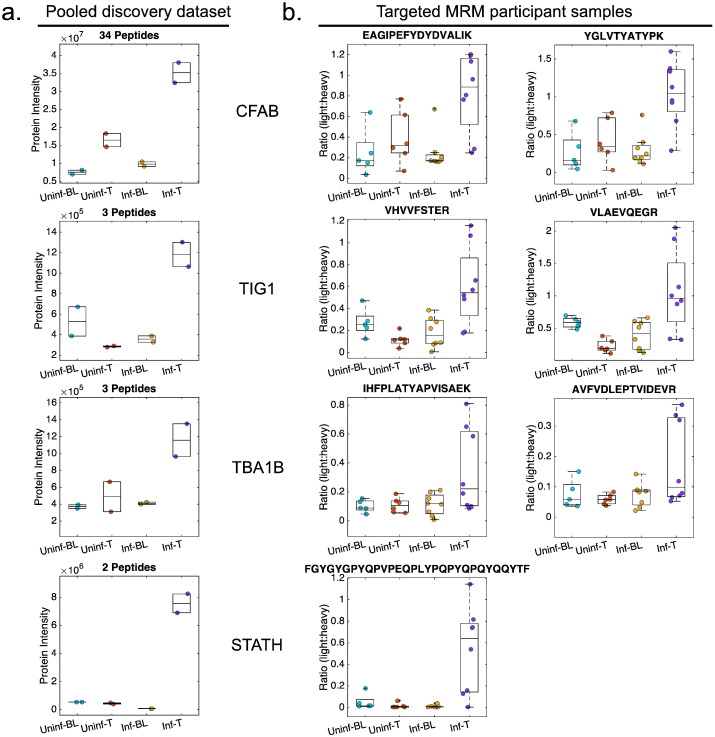
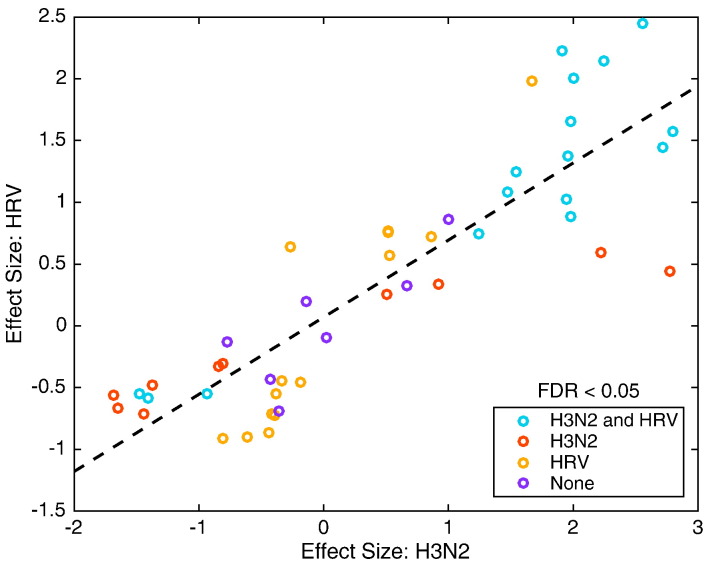
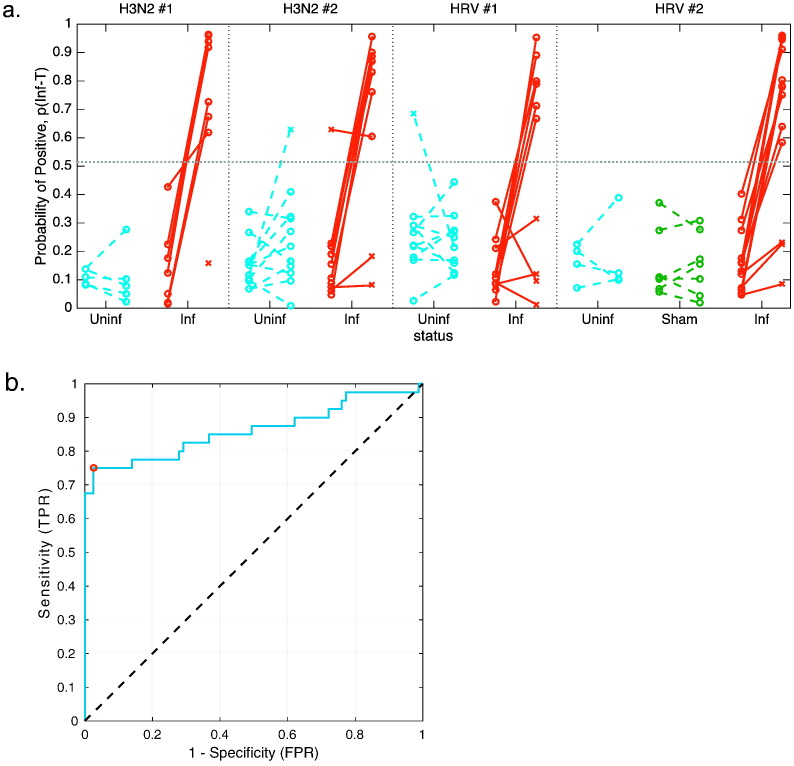
Infection of respiratory mucosa with viral pathogens triggers complex immunologic events in the affected host. We sought to characterize this response through proteomic analysis of nasopharyngeal lavage in human subjects experimentally challenged with influenza A/H3N2 or human rhinovirus, and to develop targeted assays measuring peptides involved in this host response allowing classification of acute respiratory virus infection. Unbiased proteomic discovery analysis identified 3285 peptides corresponding to 438 unique proteins, and revealed that infection with H3N2 induces significant alterations in protein expression. These include proteins involved in acute inflammatory response, innate immune response, and the complement cascade. These data provide insights into the nature of the biological response to viral infection of the upper respiratory tract, and the proteins that are dysregulated by viral infection form the basis of signature that accurately classifies the infected state. Verification of this signature using targeted mass spectrometry in independent cohorts of subjects challenged with influenza or rhinovirus demonstrates that it performs with high accuracy (0.8623 AUROC, 75% TPR, 97.46% TNR). With further development as a clinical diagnostic, this signature may have utility in rapid screening for emerging infections, avoidance of inappropriate antibacterial therapy, and more rapid implementation of appropriate therapeutic and public health strategies.
Keywords: Diagnostic biomarker; Human rhinovirus; Infectious disease; Influenza; Proteomics.
Copyright © 2017 The Authors. Published by Elsevier B.V. All rights reserved.
Figures
Comment in
-
Mass Spectrometry Reveals Respiratory Viral Infection Biomarkers.EBioMedicine. 2017 Apr;18:21-22. doi: 10.1016/j.ebiom.2017.04.007. Epub 2017 Apr 7. EBioMedicine. 2017. PMID: 28412248 Free PMC article. No abstract available.
References
-
- Addona T.A., Abbatiello S.E., Schilling B., Skates S.J., Mani D.R., Bunk D.M., Spiegelman C.H., Zimmerman L.J., Ham A.J., Keshishian H., Hall S.C., Allen S., Blackman R.K., Borchers C.H., Buck C., Cardasis H.L., Cusack M.P., Dodder N.G., Gibson B.W., Held J.M., Hiltke T., Jackson A., Johansen E.B., Kinsinger C.R., Li J., Mesri M., Neubert T.A., Niles R.K., Pulsipher T.C., Ransohoff D., Rodriguez H., Rudnick P.A., Smith D., Tabb D.L., Tegeler T.J., Variyath A.M., Vega-Montoto L.J., Wahlander A., Waldemarson S., Wang M., Whiteaker J.R., Zhao L., Anderson N.L., Fisher S.J., Liebler D.C., Paulovich A.G., Regnier F.E., Tempst P., Carr S.A. Multi-site assessment of the precision and reproducibility of multiple reaction monitoring-based measurements of proteins in plasma. Nat. Biotechnol. 2009;27:633–641. - PMC - PubMed
-
- Bhoj V.G., Sun Q., Bhoj E.J., Somers C., Chen X., Torres J.P., Mejias A., Gomez A.M., Jafri H., Ramilo O., Chen Z.J. MAVS and MyD88 are essential for innate immunity but not cytotoxic T lymphocyte response against respiratory syncytial virus. Proc. Natl. Acad. Sci. U. S. A. 2008;105:14046–14051. - PMC - PubMed
-
- Byington C.L., Ampofo K., Stockmann C., Adler F.R., Herbener A., Miller T., Sheng X., Blaschke A.J., Crisp R., Pavia A.T. Community surveillance of respiratory viruses among families in the Utah better identification of germs-longitudinal viral epidemiology (BIG-LoVE) study. Clin. Infect. Dis. 2015;61:1217–1224. - PMC - PubMed
MeSH terms
Substances
Grants and funding
LinkOut - more resources
Full Text Sources
Other Literature Sources
Medical
