. 2017 Apr 7;429(7):1045-1066.
doi: 10.1016/j.jmb.2017.02.012. Epub 2017 Feb 24.

Cullin E3 Ligase Activity Is Required for Myoblast Differentiation

Affiliations

Cullin E3 Ligase Activity Is Required for Myoblast Differentiation

Jordan Blondelle et al. J Mol Biol. .

Abstract

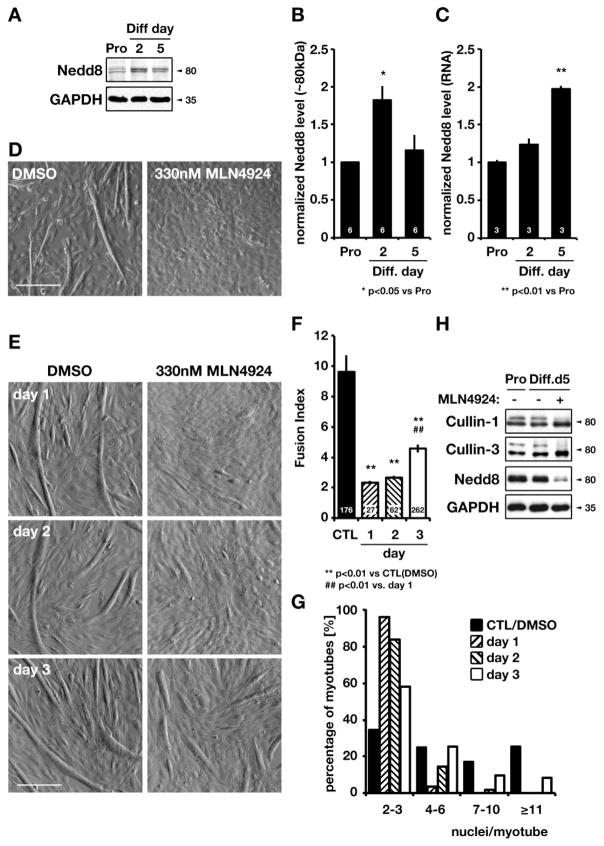
The role of cullin E3-ubiquitin ligases for muscle homeostasis is best known during muscle atrophy, as the cullin-1 substrate adaptor atrogin-1 is among the most well-characterized muscle atrogins. We investigated whether cullin activity was also crucial during terminal myoblast differentiation and aggregation of acetylcholine receptors for the establishment of neuromuscular junctions in vitro. The activity of cullin E3-ligases is modulated through post-translational modification with the small ubiquitin-like modifier nedd8. Using either the Nae1 inhibitor MLN4924 (Pevonedistat) or siRNA against nedd8 in early or late stages of differentiation on C2C12 myoblasts, and primary satellite cells from mouse and human, we show that cullin E3-ligase activity is necessary for each step of the muscle cell differentiation program in vitro. We further investigate known transcriptional repressors for terminal muscle differentiation, namely ZBTB38, Bhlhe41, and Id1. Due to their identified roles for terminal muscle differentiation, we hypothesize that the accumulation of these potential cullin E3-ligase substrates may be partially responsible for the observed phenotype. MLN4924 is currently undergoing clinical trials in cancer patients, and our experiments highlight concerns on the homeostasis and regenerative capacity of muscles in these patients who often experience cachexia.

Keywords: E3-ubiquitin ligase; MLN4924; cullin; muscle development.


Figures

Figure 1
Figure 1. Cullin E3-ligase activity is required for myotube formation in C2C12 cells
A) Analysis if proteins modified by nedd8 in C2C12 cells during proliferation (Pro), or during differentiation at day 2 and 5. GAPDH is shown to demonstrate equal loading of the samples. B) Quantification of GAPDH normalized nedd8 modified protein levels around 80kDa (from A). C) Quantification of nedd8 mRNA levels, normalized against cyclophilin B. B-C) Sample size and p-values are shown in the figure. D) Representative brightfield images of C2C12 after 5 days in differentiation medium. Cells have been treated with vehicle control (DMSO) or 330nM NAE1 inhibitor MLN4924 from the onset of differentiation. Scale bar = 40μm. E) Representative brightfield images of C2C12 after 5 days in differentiation medium. Cells have been treated with vehicle control (DMSO) or 330nM NAE1 inhibitor MLN4924 one, two or three days after start of differentiation. Scale bar = 40μm. F) Quantification of C2C12 fusion index for C2C12 cells exposed after one, two or three days of differentiation start with 330nM MLN4924, or vehicle control (DMSO). Sample size and p-values are indicated in the figure. G) Percentage of counted myotubes with 2–3, 4–6, 7–10 or more than 11 nuclei per myotube, from C2C12 cultures exposed to 330nM MLN4924 after one, two or three days of differentiation, or vehicle control (DMSO). H) Immunoblot analyses of cullin-1, cullin-3, and nedd8 expression levels of C2C12 cells in proliferation (Pro), or after 5 days in differentiation (Diff) medium with 300nM MLN4924 (+) or vehicle control (DMSO, −). GAPDH was used as loading control.
Figure 2
Figure 2. MLN4924 dose-response curve and nedd8 siRNA
A) Immunofluorescence analysis of C2C12 cells differentiated for 5 days in presence of 30nM, 130nM, 230nM or 330nM MLN4924, or vehicle control (DMSO). Cells were stained with an antibody against pan-sarcomeric myosin heavy chain (MyHC). DAPI was used as counterstain. Scale bar = 100μm. B) Quantification of fusion index in response to increasing MLN4924 concentrations. Shown are average fusion indexes, standard errors and p-values (indicated in figure). Grey line indicates fitted curve to determine IC50 value. C) Immunoblot analysis of nedd8 and pan-sarcomeric myosin heavy chain (MyHC) protein levels in total protein samples of C2C12 cells differentiated for 5 days in presence of 30nM, 130nM, 230nM or 330nM MLN4924, or vehicle control (0nM MLN4924; DMSO). GAPDH was used as loading control. D) Immunoblot analysis of nedd8 in C2C12 after 3 days of differentiation. E & F) Immunofluorescence analysis (E) and fusion index (F) of differentiated C2C12 cells transfected with siRNA against nedd8 or scrambled control (CTL). Cells were differentiated for 5 days and stained with an antibody against pan-sarcomeric myosin heavy chain (MyHC). DAPI was used as counterstain. Scale bar = 100μm. Standard errors and p-values are indicated in the figure. G) Immunoblot analysis of pan-sarcomeric myosin heavy chain (MyHC) in differentiated C2C12 after 5 days. Ponceau (D) or GAPDH (G) were used as loading controls.
Figure 3
Figure 3. MLN4924 inhibits entry into the terminal myogenic differentiation program
A & B) Immunofluorescence analysis of C2C12 cells differentiated for 5 days in presence or absence of 330nM MLN4924, stained with antibodies against sarcomeric myosin heavy chain (MyHC) and desmin (A), or alpha-actinin (B). DAPI was used as counterstain in A and B. Scale bar = 50μm. C) Immunoblot analysis of pan-sarcomeric myosin heavy chain (MyHC) and myogenin expression in whole cell lysates of C2C12 cells either in proliferation (Pro), or after 5 days in differentiation (Diff) medium with 300nM MLN4924 (+) or vehicle control (DMSO, −). GAPDH was used as loading control. D–F) Relative normalized protein levels of nedd8 protein levels (80kDa band, D), myogenin (E) and pan-sarcomeric myosin heavy chain (MyHC, F) in MLN4924 (MLN) treated C2C12 cells five days after differentiation compared to controls (CTL). Three independent samples were run per group; p-values are indicated in the figure.
Figure 4
Figure 4. Cullin E3-ligase activity is required for myotube formation of mouse and human muscle stem cells
A) Immunofluorescence analysis of primary cultures of mouse muscle stem cells after 5 days of differentiation. Cells were differentiated in presence of 330nM MLN4924 or vehicle control (DMSO), and stained with antibodies against desmin and pan-sarcomeric myosin heavy chain (MyHC). DAPI was used as counterstain. Scale bar = 100μm. B) Immunoblot analysis of cullin-1 and pan-sarcomeric myosin heavy chain (MyHC) protein levels in total lysates of differentiated primary mouse muscle stem cell cultures, treated with 330nM MLN4924 (+) or vehicle control (DMSO, −). GAPDH and ponceau stained actin band were used as loading controls. C & D) Immunofluorescence analysis of human muscle stem cells after 5 days of differentiation in presence of 330nM MLN4924 or vehicle control (DMSO). Cells were stained with antibodies against slow myosin heavy chain 7 (MyHC; C) or myogenin (D). DAPI and fluorescently labeled WGA were used as counterstains. Scale bar = 100μm.
Figure 5
Figure 5. Effect of cullin E3-ligase inhibition on agrin-induced acetylcholine receptor clustering in C2C12 cells
A) Immunofluorescence analysis of agrin treated C2C12 cells 5 days after differentiation, in presence of 330nM MLN4924 or vehicle control (DMSO). Cells were stained with antibodies against pan-sarcomeric myosin heavy chain (MyHC), and fluorescently labeled alpha-bungarotoxin (BTX) to visualize acetylcholine receptors. DAPI was used as counterstain. Scale bar = 50μm. B–F) Quantitative analysis of myotube length (B), fusion index (nuclei/myotube; C), number of acetylcholine receptor clusters per myotube (D), acetylcholine receptor cluster number per mm2 (E) and cluster length per mm2 (F). Shown are averages and standard errors. Sample size and p-values are indicated in the figure.
Figure 6
Figure 6. Effect of cullin E3-ligase inhibition on terminal muscle differentiation are reversible
A) Immunofluorescence analysis of C2C12 cells after ten days of differentiation in vehicle (10d DMSO) supplemented differentiation medium, compared to cells cultured for five days in differentiation medium supplemented with 300nM MLN4924 followed by five days in differentiation medium (5d MLN / 5d diff.). Cells were stained with antibodies against pan-sarcomeric myosin heavy chain (MyHC) and desmin. DAPI was used as counterstain. Scale bar = 100μm. B) Quantitative analysis of fusion index of differentiated C2C12 cells as in (A), compared to average fusion index of differentiated C2C12 cells after five days in culture (5d DMSO-CTL). Shown are averages and standard errors. Sample sizes and p-values are indicated in the figure. C) Immunoblot analysis of whole cell lysates of C2C12 cells differentiated for 5 days with MLN4924, followed by 5 days differentiation medium (5d/5d), compared to MLN4924 treated (MLN) as well as vehicle treated control (CTL, DMSO) cells differentiated for 10 days. Shown are representative immunoblots stained with antibodies against pan-sarcomeric myosin heavy chain (MyHC) and nedd8. GAPDH was used as loading control. D) Quantitative analysis of myosin heavy chain protein levels (as in C).
Figure 7
Figure 7. 5-aza-dC (Aza) partially alleviates the inhibitory effects of MLN4924 on terminal C2C12 differentiation
A) Immunofluorescence of C2C12 cells five days after differentiation in presence of 330nM MLN4924 alone, in combination with 10μM 5-aza-dC (Aza), or vehicle control (DMSO). Cells were stained with an antibody against alpha-actinin (green in overlay). DAPI (blue in overlay) was used as counterstain. Scale bar = 100μm. B) Fraction analysis of nuclei per alpha-actinin positive cells in 330nM MLN4924 (MLN) treated, or 330nM MLN4924 and 10μM Aza treated C2C12 five days after differentiation, compared to vehicle control (CTL/DMSO). Sample size (total counted nuclei) and p-values are indicated in the figure. C) Analysis of alpha-actinin positive cells per mm2 in presence of MLN4924 (MLN) alone, in combination with 10μM Aza, or in control (CTL). Sample size of alpha actinin positive cells, and p-values are indicated in the figure. D) Quantitative PCR analysis of relative normalized (against GAPDH) myogenin expression in proliferative C2C12 myoblasts cultures (Pro), compared to C2C12 differentiated for five days in presence of 330nM MLN4924 (MLN) alone, or in combination with 10μM Aza, or vehicle treated control (CTL, DMSO). Sample size (biological replicates) and p-values are indicated in the figure. (n.s. = non-significant). E) Immunoblot analysis of sarcomeric myosin heavy chain (MyHC) and nedd8 protein levels in differentiated C2C12 cells after five days in culture. Samples are total protein lysates of cells treated with 330nM MLN4924 (MLN) alone, or in combination with 10μM Aza. F, G) Fusion index (F) and cluster analysis of nuclei/myotube (G) of 330nM MLN4924 (MLN) treated, or 330nM MLN4924 and 10μM Aza treated C2C12 five days after differentiation, compared to vehicle control (CTL/DMSO). Sample size and p-values (in F) are indicated in the figure.
Figure 8
Figure 8. Analysis of protein degradation of myogenic repressors ZBTB38, Bhlhe41 and Id1
A) Analysis of ZBTB38 protein levels in C2C12 cells during proliferation or 2 days after differentiation in presence of either DMSO (Ctl), 330nM MLN4924 (MLN) or 330nM MLN4924 (MLN) and 10μM 5-aza-dC (Aza). Ponceau was used to demonstrate equal loading. Shown are a representative immunoblot (upper panel) and the quantification of protein levels (lower panel). Sample size and p-values are indicated in the figure. B, C) Analysis of protein interaction between cullin-3 and either full length ZBTB38 in a co-immunoprecipitation experiment (B) or the BTB-domain of ZBTB38 only in a GST-pulldown experiment (C) indicates no association between the two proteins. GAPDH and normal rabbit-IgG were used as controls in (B). GST alone was used as control in (C). Abbreviations: IN-Input, FT-flow-through, IP-immunoprecipitate, CTL-control. D) Analysis of subcellular ZBTB38 distribution during proliferation and differentiation at 2 and 5 days of C2C12 cells. Cells were stained with an antibody against ZBTB38, and labeled with DAPI to outline nuclei. Arrows indicate primarily nuclear localized ZBTB38 in proliferative and undifferentiated C2C12 cells, whereas arrowheads point to nuclei of differentiated C2C12 cells. Scale bar = 50μm. E) Analysis of Bhlh41 and Id1 protein levels during proliferation (Pro) and 2 days after onset of differentiation (Diff.) in presence (MLN) or absence (Ctl) of MLN4924. Ponceau staining of total proteins (actin band) was used as loading control.
Figure 9
Figure 9. Cullin requirement in the terminal skeletal muscle differentiation process
Overview of biological steps and developmental milestones for the differentiation from pluripotent progenitor stem cells, to skeletal muscle stem cells (satellite cells), into skeletal muscle myofibers that are anchored by tendons (muscle-tendon unit; MTU). Shown are marker genes and their approximate temporal expression during the differentiation process. Effect of cullin E3-ubiquitin ligase inhibition for each of the differentiation steps is indicated. Figure adapted from [92].

Similar articles

Cited by

References

    1. Blaauw B, Schiaffino S, Reggiani C. Mechanisms modulating skeletal muscle phenotype. Compr Physiol. 2013;3:1645–87. - PubMed
    1. Sandri M. Protein breakdown in muscle wasting: role of autophagy-lysosome and ubiquitin-proteasome. Int J Biochem Cell Biol. 2013;45:2121–9. - PMC - PubMed
    1. Blondelle J, Lange S. Cardiac Cytoarchitecture: How to Maintain a Working Heart Waste—Disposal and Recycling in Cardiomyocytes. In: Ehler E, editor. Cardiac Cytoarchitecture. 1. Springer; 2015. pp. 245–309.
    1. Goldberg AL. Protein degradation and protection against misfolded or damaged proteins. Nature. 2003;426:895–9. - PubMed
    1. Bonaldo P, Sandri M. Cellular and molecular mechanisms of muscle atrophy. Dis Model Mech. 2013;6:25–39. - PMC - PubMed

Publication types

Substances

LinkOut - more resources