

A novel principal component analysis for spatially misaligned multivariate air pollution data
- PMID: 28239196
- PMCID: PMC5321560
- DOI: 10.1111/rssc.12148
A novel principal component analysis for spatially misaligned multivariate air pollution data
Abstract
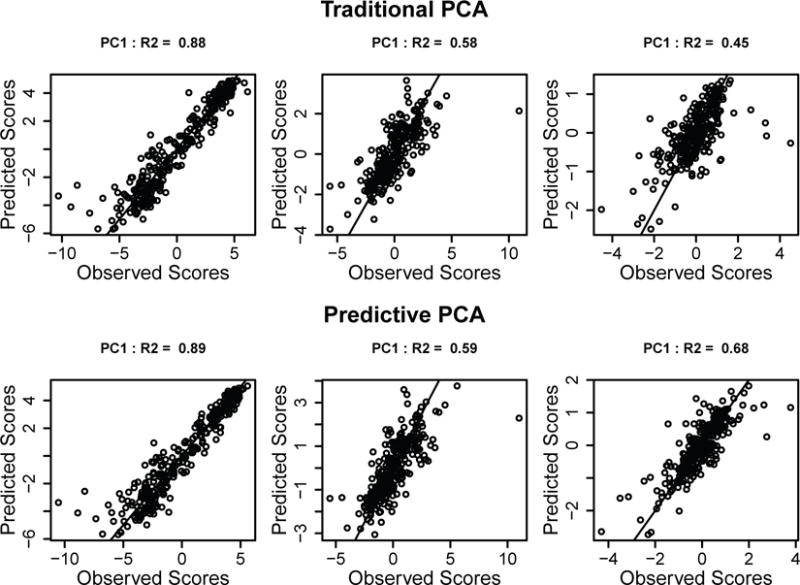
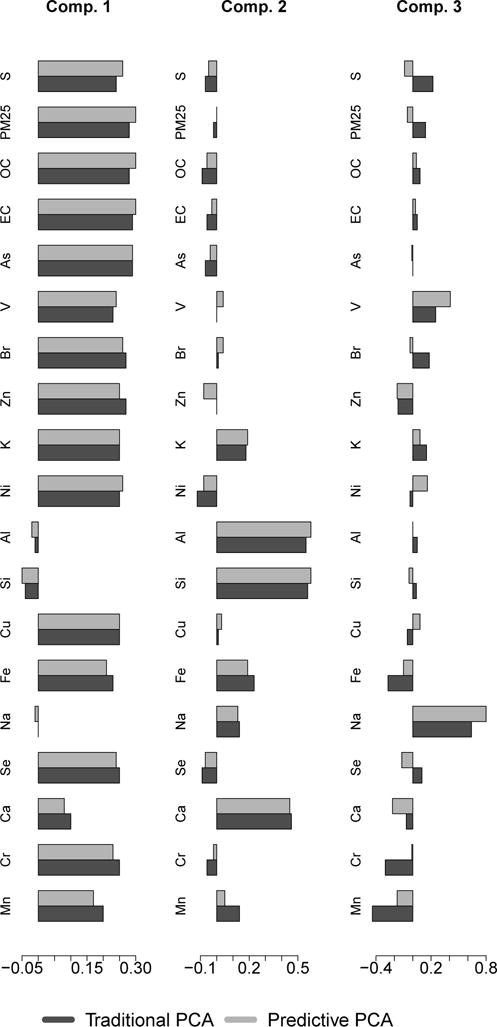
We propose novel methods for predictive (sparse) PCA with spatially misaligned data. These methods identify principal component loading vectors that explain as much variability in the observed data as possible, while also ensuring the corresponding principal component scores can be predicted accurately by means of spatial statistics at locations where air pollution measurements are not available. This will make it possible to identify important mixtures of air pollutants and to quantify their health effects in cohort studies, where currently available methods cannot be used. We demonstrate the utility of predictive (sparse) PCA in simulated data and apply the approach to annual averages of particulate matter speciation data from national Environmental Protection Agency (EPA) regulatory monitors.
Keywords: Air pollution; Dimension reduction; Principal component analysis; Spatial misalignment; Universal kriging.
Figures


References
-
- Abdi H. Partial least squares regression (pls-regression) Encyclopedia for research methods for the social sciences. 2003:792–795.
-
- Analitis A, Michelozzi P, DIppoliti D, deDonato F, Menne B, Matthies F, Atkinson RW, Iñiguez C, Basagaña X, Schneider A, et al. Effects of heat waves on mortality: effect modification and confounding by air pollutants. Epidemiology. 2014;25(1):15–22. - PubMed
-
- Anderson TW. An Introduction to Multivariate Statistical Analysis. 2003. (Wiley Series in Probability and Statistics).
Publication types
Grants and funding
LinkOut - more resources
Full Text Sources
Other Literature Sources
Research Materials