. 2017;26(1):182-194.
doi: 10.1080/10618600.2016.1159212. Epub 2017 Feb 16.

Efficient computation of the joint sample frequency spectra for multiple populations

Affiliations

Efficient computation of the joint sample frequency spectra for multiple populations

John A Kamm et al. J Comput Graph Stat. 2017.

Abstract

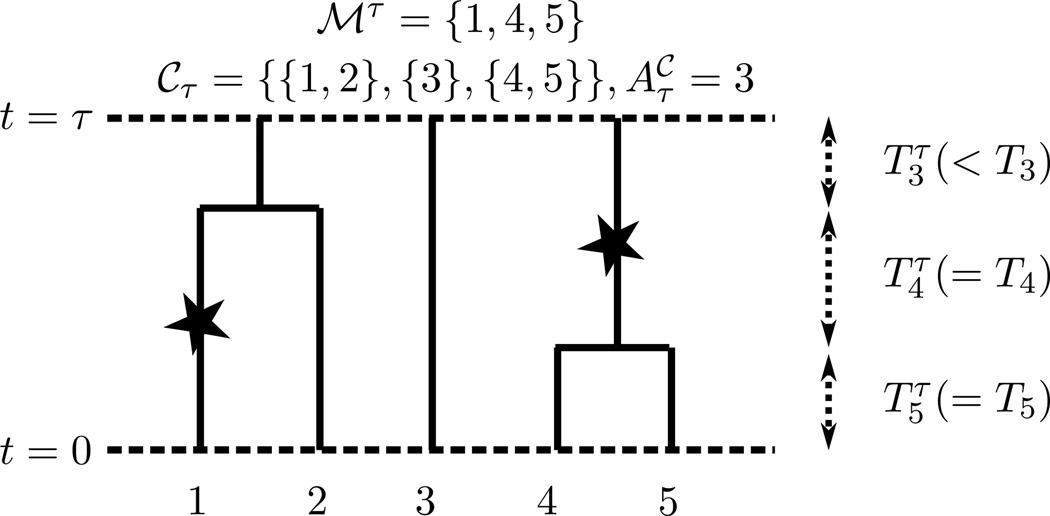
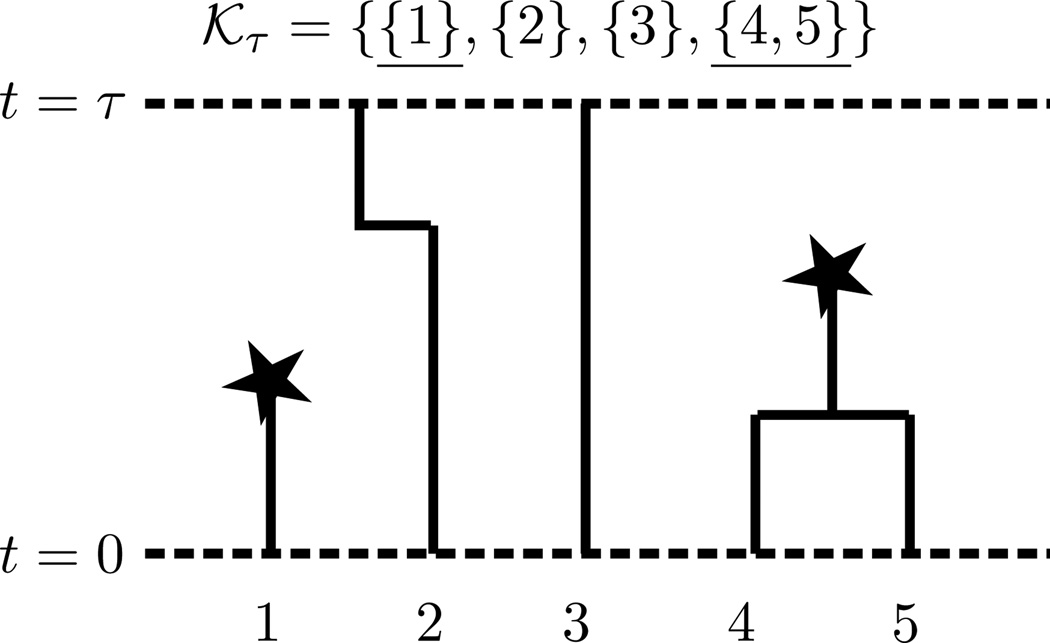
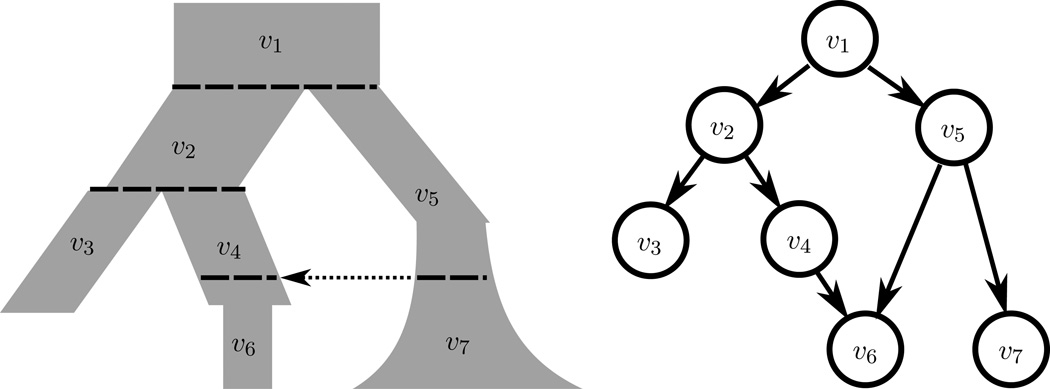
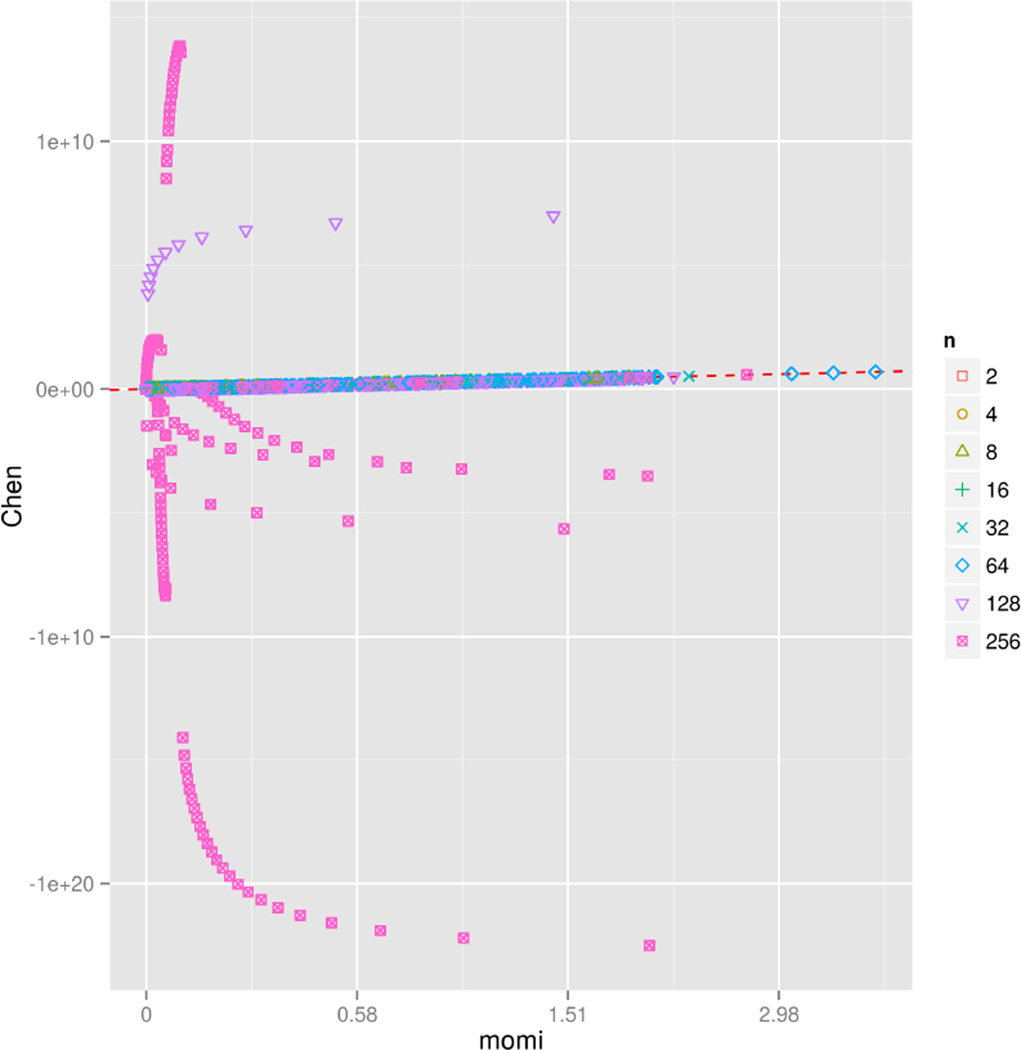
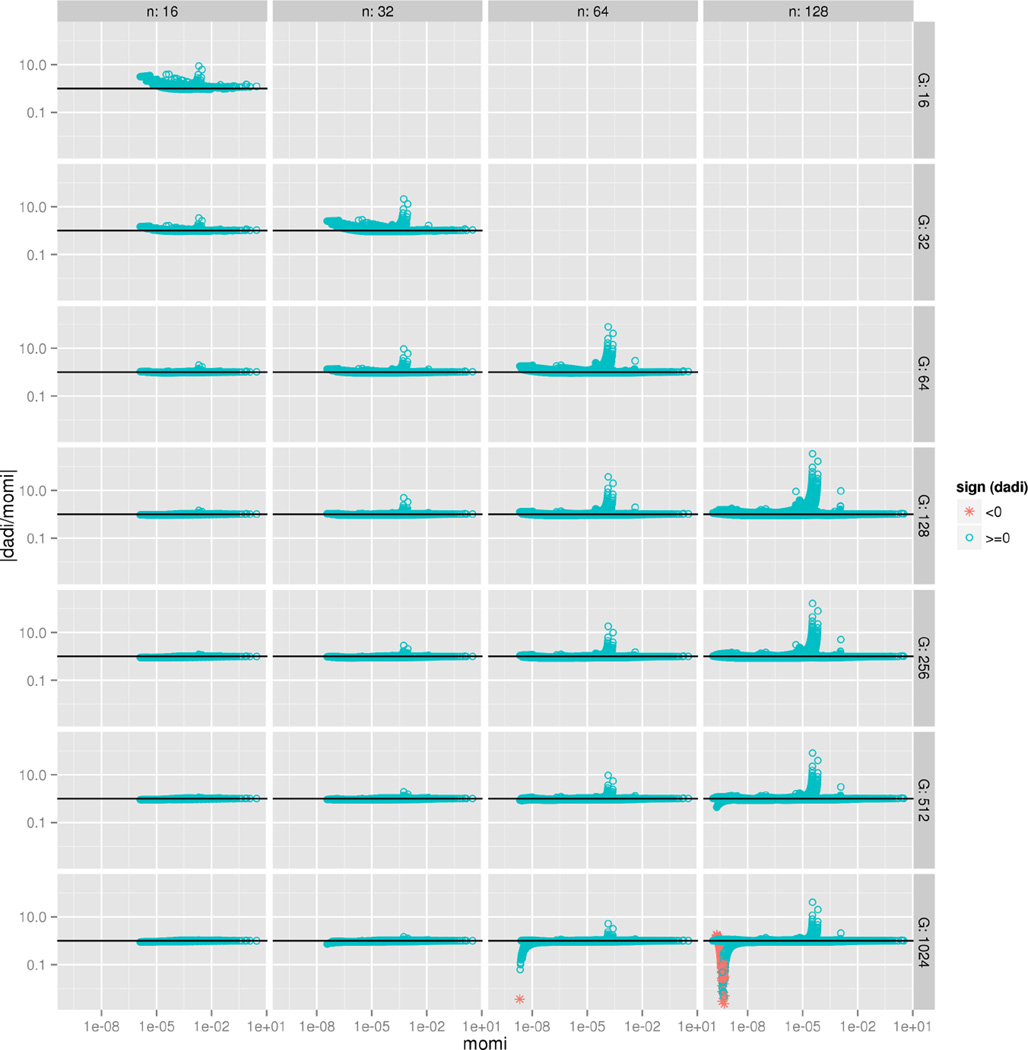
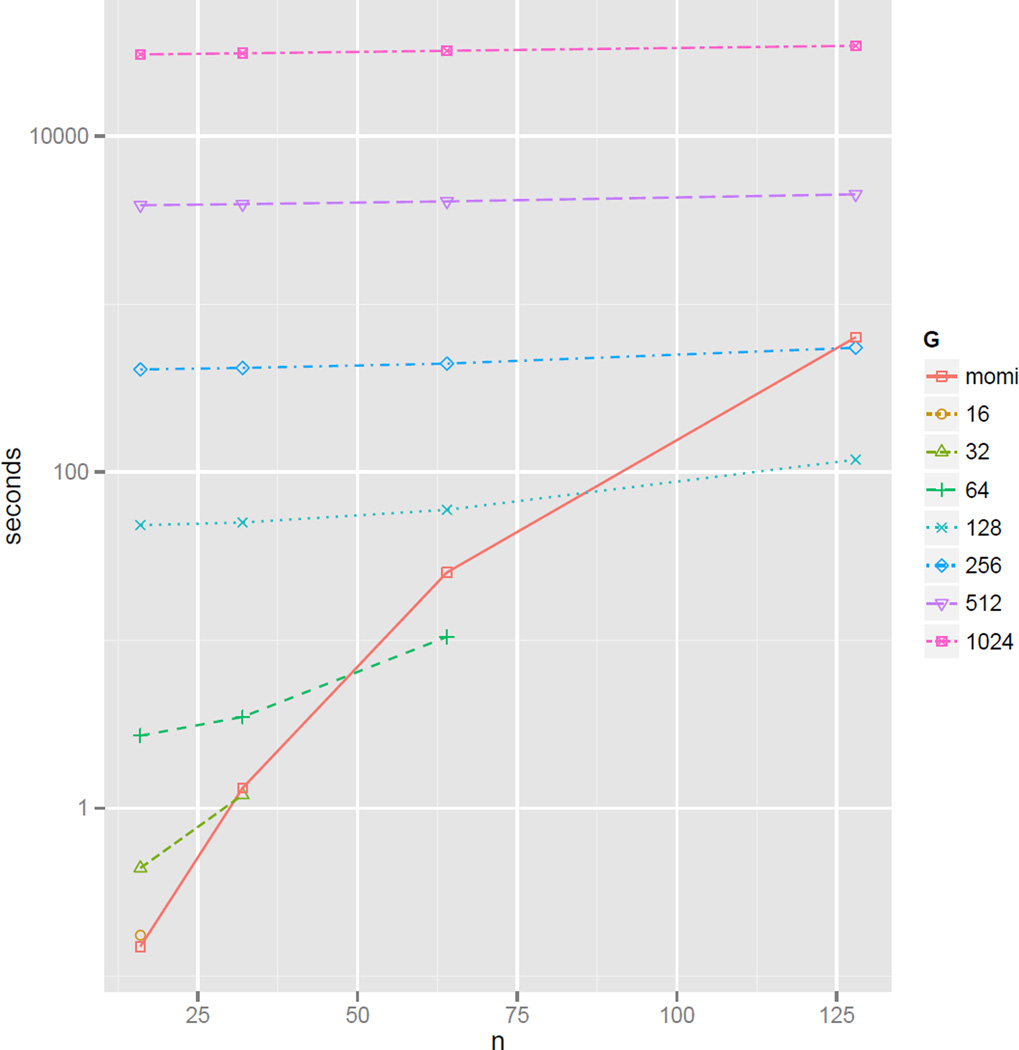
A wide range of studies in population genetics have employed the sample frequency spectrum (SFS), a summary statistic which describes the distribution of mutant alleles at a polymorphic site in a sample of DNA sequences and provides a highly efficient dimensional reduction of large-scale population genomic variation data. Recently, there has been much interest in analyzing the joint SFS data from multiple populations to infer parameters of complex demographic histories, including variable population sizes, population split times, migration rates, admixture proportions, and so on. SFS-based inference methods require accurate computation of the expected SFS under a given demographic model. Although much methodological progress has been made, existing methods suffer from numerical instability and high computational complexity when multiple populations are involved and the sample size is large. In this paper, we present new analytic formulas and algorithms that enable accurate, efficient computation of the expected joint SFS for thousands of individuals sampled from hundreds of populations related by a complex demographic model with arbitrary population size histories (including piecewise-exponential growth). Our results are implemented in a new software package called momi (MOran Models for Inference). Through an empirical study we demonstrate our improvements to numerical stability and computational complexity.

Keywords: coalescent; demographic inference; population genetics; sum-product algorithm.


Figures

Figure 1
Figure 1
A sample path of the coalescent truncated at time τ. Star symbols denote mutations, while ℳτ denotes the set of leaves under those mutations. Tkτ denotes the waiting time in the interval [0, τ) while there are k lineages.
Figure 2
Figure 2
The coalescent with killing for the genealogy in Figure 1. Note that 𝒦τ is a marked partition, with the blocks killed by mutations in [0, τ) being specially marked.
Figure 3
Figure 3
A demographic history with a pulse migration event (left), and its corresponding directed graph (right).
Figure 4
Figure 4
Average computation time of the joint SFS. For each combination of the sample size n and the number 𝒟 of populations (with n𝒟 samples per population), we generated 20 random datasets, each under a demographic history that is a random binary tree. The expected joint SFS for the resulting segregating sites were then computed using our method (momi) and that of Chen (2012). In the top row, we plot the average runtime per joint SFS entry, and in the bottom row, the average amount of time needed to precompute the truncated SFS for every subpopulation within each demographic history. (a) Runtime results plotted separately for each method in a linear scale. Note the y-axis is on a different scale for each row. (b) Runtime results with the axes on a log-log scale, so that shorter runtimes are visible.
Figure 5
Figure 5
Numerical stability of the two algorithms. The plot compares the numerical values returned by our method (momi) and Chen’s method, for the simulations described in Figure 4. The dashed red line represents the identity y = x. To adequately illustrate the full numerical range (both positive and negative) of values encountered in the simulations, we applied the transformation z ↦ sign(z) log(1 + |z|) to the values of each method in order to produce the scatter plot. The two methods agree for n ≤ 64, while Chen’s method is extremely unstable for larger n.
Figure 6
Figure 6
Comparison of SFS values computed by ∂ai and momi, varying the sample size n per population and the number G of grid points per population in ∂ai. We used the 3-population out-of-Africa demography inferred in Gutenkunst et al. (2009), but modified to have no gene flow (migration). The x-axis is fmomi(x) the value computed by momi, the y-axis is the absolute value of the ratio |fai(x)fmomi(x)|, and the color gives the sign of fai(x) (all values returned by momi were positive). fai generally converges to fmomi(x) as G increases, but for large values of n and G, ∂ai appears to diverge, and returns some negative values.
Figure 7
Figure 7
Runtime of momi and ∂ai to compute the results in Figure 6.

References

    1. Al-Mohy AH, Higham NJ. Computing the action of the matrix exponential, with an application to exponential integrators. SIAM Journal on Scientific Computing. 2011;33(2):488–511.
    1. Aldous DJ. Exchangeability and related topics. In: Hennequin P, editor. École d' Été de Probabilités de Saint-Flour XIII — 1983, volume 1117 of Lecture Notes in Mathematics. Berlin Heidelberg: Springer; 1985. pp. 1–198.
    1. Beaumont MA, Nichols RA. Evaluating loci for use in the genetic analysis of population structure. Proceedings of the Royal Society of London. Series B: Biological Sciences. 1996;263(1377):1619–1626.
    1. Bhaskar A, Kamm JA, Song YS. Approximate sampling formulae for general finite-alleles models of mutation. Advances in Applied Probability. 2012;44:408–428. (PMC3953561) - PMC - PubMed
    1. Bhaskar A, Song YS. Descartes’ rule of signs and the identifiability of population demographic models from genomic variation data. Annals of Statistics. 2014;42(6):2469–2493. - PMC - PubMed

LinkOut - more resources