. 2017 Feb 10:11:47.
doi: 10.3389/fnins.2017.00047. eCollection 2017.

MicroPET Outperforms Beta-Microprobes in Determining Neuroreceptor Availability under Pharmacological Restriction for Cold Mass Occupancy

Affiliations

MicroPET Outperforms Beta-Microprobes in Determining Neuroreceptor Availability under Pharmacological Restriction for Cold Mass Occupancy

Dorien Glorie et al. Front Neurosci. .

Abstract

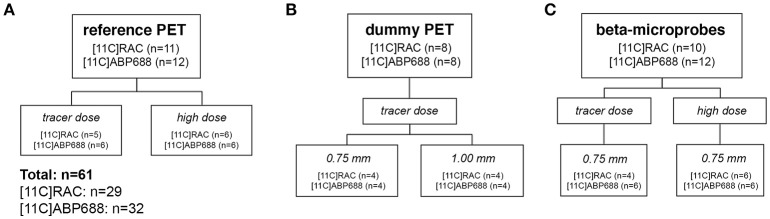
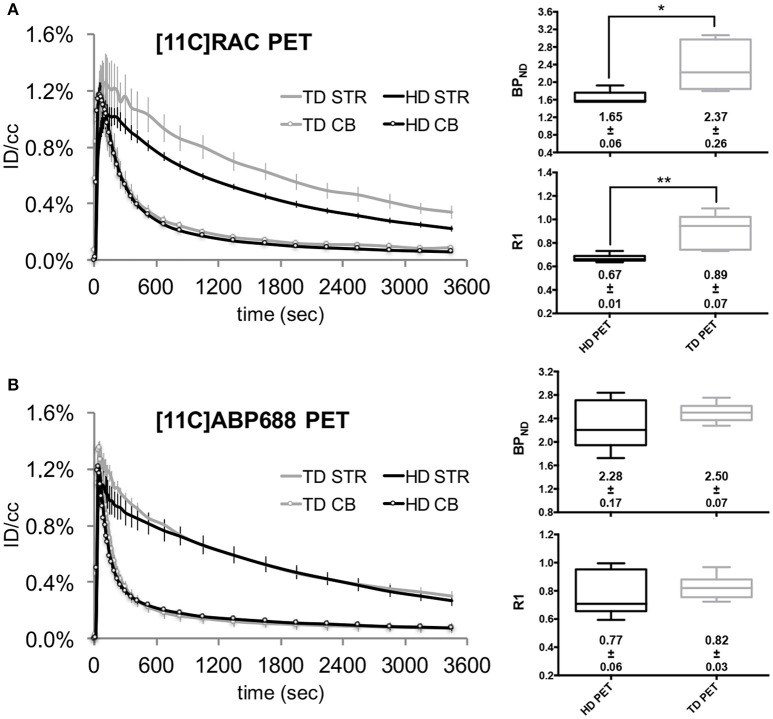
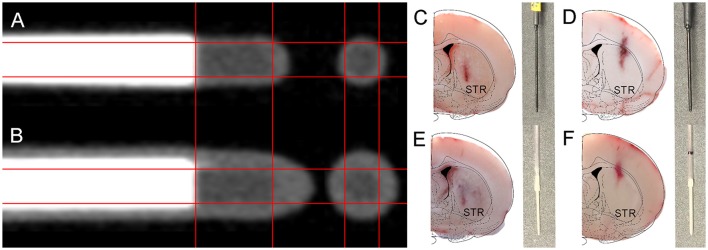
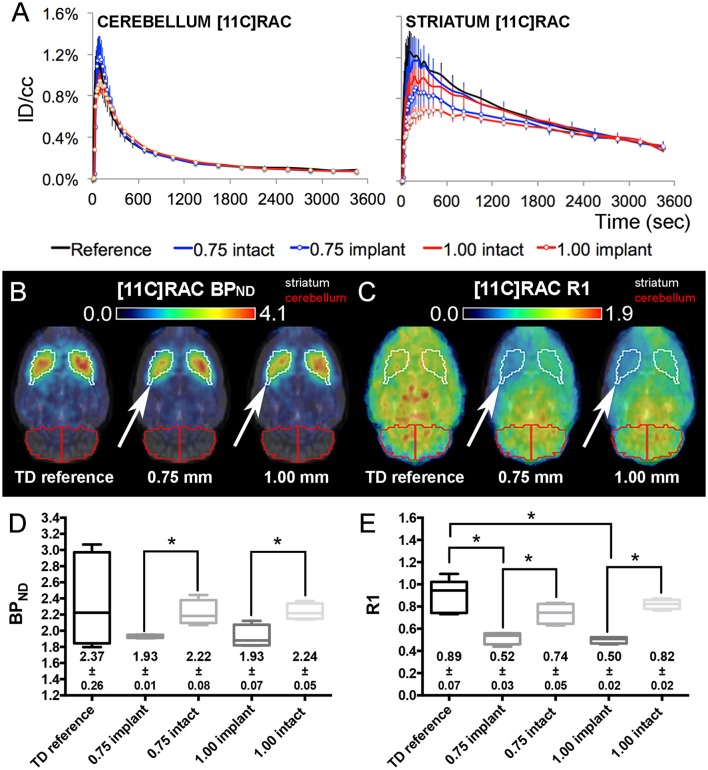
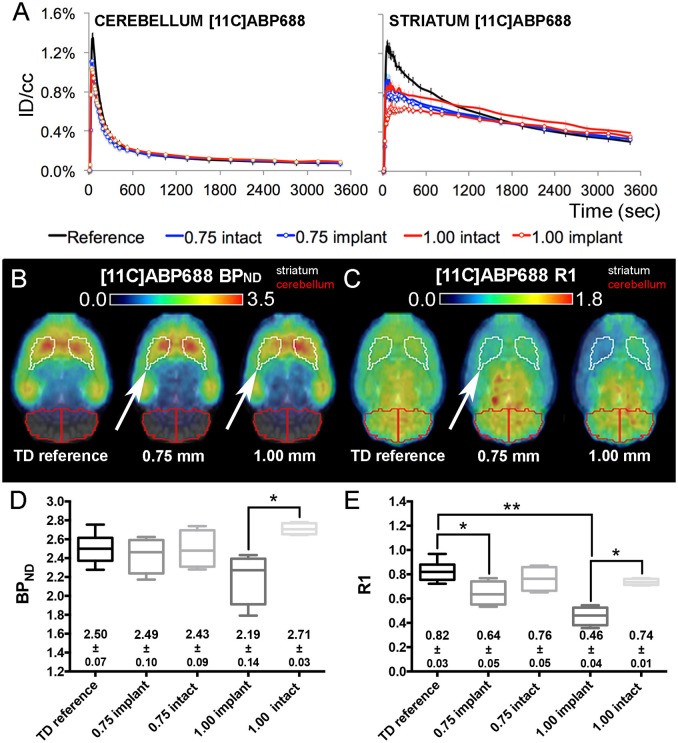
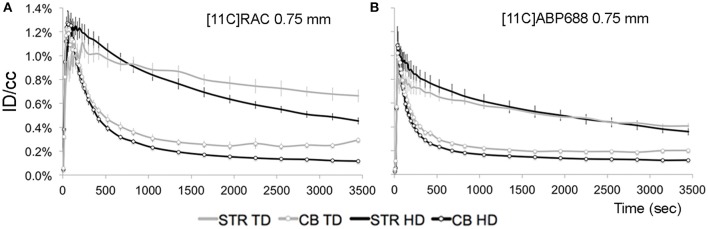
Both non-invasive micro-positron emission tomography (μPET) and in situ beta-microprobes have the ability to determine radiotracer kinetics and neuroreceptor availability in vivo. Beta-microprobes were proposed as a cost-effective alternative to μPET, but literature revealed conflicting results most likely due to methodological differences and inflicted tissue damage. The current study has three main objectives: (i) evaluate the theoretical advantages of beta-microprobes; (ii) perform μPET imaging to assess the impact of (beta-micro)probe implantation on relative tracer delivery (R1) and receptor occupancy (non-displaceable binding potential, BPND) in the rat brain; and (iii) investigate whether beta-microprobe recordings produce robust results when a pharmacological restriction for cold mass dose (tracer dose condition) is imposed. We performed acquisitions (n = 61) in naive animals, dummy probe implanted animals (outer diameter: 0.75 and 1.00 mm) and beta-microprobe implanted animals (outer diameter: 0.75 mm) using two different radiotracers with high affinity for the striatum: [11C]raclopride (n = 29) and [11C]ABP688 (n = 32). In addition, acquisitions were completed with or without an imposed restriction for cold mass occupancy. We estimated BPND and R1 values using the simplified reference tissue method (SRTM). [11C]raclopride dummy μPET BPND (0.75 mm: -13.01 ± 0.94%; 1.00 mm: -13.89 ± 1.20%) and R1 values (0.75 mm: -29.67 ± 4.94%; 1.00 mm: -39.07 ± 3.17%) significantly decreased at the implant side vs. the contralateral intact side. A similar comparison for [11C]ABP688 dummy μPET, demonstrated significantly (p < 0.05) decreased BPND (-19.09 ± 2.45%) and R1 values (-38.12 ± 6.58%) in the striatum with a 1.00 mm implant, but not with a 0.75 mm implant. Particularly in tracer dose conditions, despite lower impact of partial volume effects, beta-microprobes proved unfit to produce representative results due to tissue destruction associated with probe insertion. We advise to use tracer dose μPET to obtain accurate results concerning receptor availability and tracer delivery, keeping in mind associated partial volume effects for which it is possible to correct.

Keywords: [11C]ABP688; [11C]raclopride; beta-microprobe; rat brain; μPET.


Figures

Figure 1
Figure 1
Study design showing the number of animals in all experimental groups for both [11C]RAC and [11C]ABP688. (A) μPET scans including low mass tracer dose (TD) and high dose (HD) acquisitions in animals without brain implants as a reference. (B) Assess the impact of the (dummy) implant OD (0.75 vs. 1.00 mm) on radiotracer kinetics and binding using μPET. (C) Clarify whether beta-microprobes provide a viable alternative for μPET, with TD as a boundary condition. This experiment included TD and HD acquisitions and was carried out using the 0.75 mm OD beta-microprobes. High dose (HD), ±65 MBq; μPET, micro positron emission tomography; low mass tracer dose (TD), [11C]RAC <0.5 nmol/kg /[11C]ABP688 <3.0 nmol/kg.
Figure 2
Figure 2
Averaged injected dose corrected time-activity curves (±s.e.m.) with the corresponding BPND and R1 values for [11C]RAC and [11C]ABP688 reference HD and TD μPET experiments. The left panels show the averaged injected dose corrected time-activity curves for HD (±65 MBq) vs. TD ([11C]RAC: <0.5 nmol/kg; [11C]ABP688: <3.0 nmol/kg) μPET experiments, for [11C]RAC (A) and [11C]ABP688 (B), respectively. The average BPND and R1 values (±s.e.m.) are displayed with the corresponding box-plot (right panels). The asterisks indicate significant (p < 0.05) differences in BPND or R1 values after a non-parametric Mann–Whitney test. CB, cerebellum; HD, high dose ±65 MBq; ID/cc, injected dose/cubic centimeter; PET, positron emission tomography; STR, striatum; TD, low mass tracer dose [11C]RAC <0.5 nmol/kg /[11C]ABP688 <3.0 nmol/kg.
Figure 3
Figure 3
Illustration of the internal composition of the available beta-microprobe sets and inflicted implant damage to the rat brain. (A,B) High resolution μCT-images from (A) 0.75 mm OD and (B) 1.00 mm OD beta-microprobes. (C–F) Results from the histological verification of probe localization in coronal cryosections of the striatum (indicated by STR; brain outline adapted from Paxinos and Watson) (Paxinos and Watson, 2013). The gray insets show the corresponding implanted probe for each cryosection: (C) 0.75 mm beta-microprobe; (D) 1.00 mm beta-microprobe; (E) 0.75 mm dummy probe; (F) 1.00 mm dummy probe.
Figure 4
Figure 4
[11C]RAC average injected dose corrected time-activity curves (±s.e.m.) combined with the corresponding BPND and R1 maps/values from TD reference and dummy μPET experiments. (A) [11C]RAC reference and dummy (0.75 and 1.00 mm) μPET time-activity curves (±s.e.m.) for the cerebellum (reference region) and the striatum (region of interest). Dummy groups received a probe implantation in both the cerebellum and striatum in contrast to the reference group. (B,C) Average transversal BPND (B) and R1 (C) maps for the reference, 0.75 mm OD dummy, and 1.00 mm OD dummy μPET groups overlaid on a magnetic resonance (MR) template. The white arrows point out the side of dummy implantation. (D,E) Box-plot representation of the BPND (D) and R1 (E) values obtained from TD μPET experiments (with and without dummy implants). The average BPND and R1 values (±s.e.m.) are displayed at the bottom of the corresponding graph. The asterisks indicate significant (p < 0.05) differences in BPND or R1 values using a non-parametric Mann–Whitney test. Remark: the time-activity curves from [11C]RAC reference TD μPET acquisitions (Figure 2A) were repeated here for a sufficient comparison of data. BPND, non-displaceable binding potential; ID/cc, injected dose/cubic centimeter; PET, positron emission tomography; R1, relative delivery; TD, low mass tracer dose <0.5 nmol/kg.
Figure 5
Figure 5
[11C]ABP688 average injected dose corrected time-activity curves (±s.e.m.) combined with the corresponding BPND and R1 maps/values from TD reference and dummy μPET experiments. (A) [11C]ABP688 reference and dummy (0.75 and 1.00 mm) μPET time-activity curves (±s.e.m.) for the cerebellum (reference region) and the striatum (region of interest). Dummy groups received a probe implantation in both the cerebellum and striatum in contrast to the reference group. (B,C) Average transversal BPND (B) and R1 (C) maps for the reference, 0.75 mm OD dummy, and 1.00 mm OD dummy μPET groups overlaid on a magnetic resonance (MR) template. The white arrows point out the side of dummy implantation. (D,E) Box-plot representation of the BPND (D) and R1 (E) values obtained from TD μPET experiments (with and without dummy implants). The average BPND and R1 values (±s.e.m.) are displayed at the bottom of the corresponding graph. The asterisks indicate significant (*p < 0.05/**p < 0.01) differences in BPND or R1 values using a non-parametric Mann–Whitney test. Remark: the time-activity curves from [11C]ABP688 reference TD μPET acquisitions (Figure 2B) were repeated here for a sufficient comparison of data. BPND, non-displaceable binding potential; ID/cc, injected dose/cubic centimeter; PET, positron emission tomography; R1, relative delivery; TD, low mass tracer dose <3.0 nmol/kg.
Figure 6
Figure 6
Average injected dose corrected time-activity curves (±s.e.m.) measured by a beta-microprobe in a high-binding region (striatum) and reference region (cerebellum) after [11C]RAC or [11C]ABP688 administration. (A) [11C]RAC striatal (without markers) and cerebellar (with markers) time-activity curves from 0.75 mm OD beta-microprobe measurements using varying dose conditions (TD vs. HD). (B) [11C]ABP688 striatal (without markers) and cerebellar (with markers) time-activity curves from 0.75 mm OD beta-microprobe measurements using varying dose conditions (TD vs. HD). CB, cerebellum; HD, high dose ±65 MBq; ID/cc, injected dose/cubic centimeter; STR, striatum; TD, low mass tracer dose [11C]RAC<0.5 nmol/kg /[11C]ABP688<3.0 nmol/kg.

Similar articles

References

    1. Alexoff D. L., Vaska P., Marsteller D., Gerasimov T., Li J., Logan J., et al. . (2003). Reproducibility of 11C-raclopride binding in the rat brain measured with the microPET R4: effects of scatter correction and tracer specific activity. J. Nucl. Med. 44, 815–822. - PubMed
    1. Ametamey S. M., Treyer V., Streffer J., Wyss M. T., Schmidt M., Blagoev M., et al. . (2007). Human PET studies of metabotropic glutamate receptor subtype 5 with 11C-ABP688. J. Nucl. Med. 48, 247–252. - PubMed
    1. Balasse L., Märk J., Pain F., Genoux A., Fieux S., Lefebvre F., et al. . (2014). PIXSIC: a wireless intracerebral radiosensitive probe in freely moving rats. Mol. Imaging 14, 484–489. - PubMed
    1. Benveniste H., Drejer J., Schousboe A., Diemer N. H. (1987). Regional cerebral glucose phosphorylation and blood flow after insertion of a microdialysis fiber through the dorsal hippocampus in the rat. J. Neurochem. 49, 729–734. 10.1111/j.1471-4159.1987.tb00954.x - DOI - PubMed
    1. Desbrée A., Pain F., Gurden H., Zimmer L., Pinot L., Lanièce P., et al. . (2004). Combining the radiosensitive beta microprobe to nuclear magnetic resonance: theoretical approach for in vivo studies in small animals. J. Neurosci. Methods 140, 47–52. 10.1016/j.jneumeth.2004.03.029 - DOI - PubMed

LinkOut - more resources