. 2017 Feb 10:11:5.
doi: 10.3389/fnsys.2017.00005. eCollection 2017.

Informative Cues Facilitate Saccadic Localization in Blindsight Monkeys

Affiliations

Informative Cues Facilitate Saccadic Localization in Blindsight Monkeys

Masatoshi Yoshida et al. Front Syst Neurosci. .

Abstract

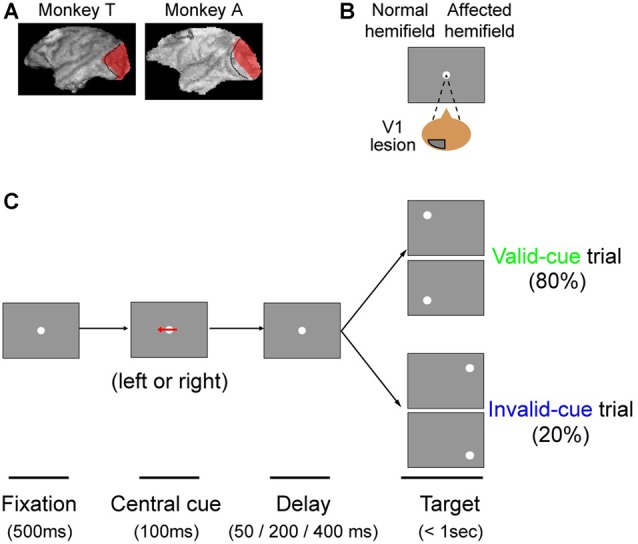
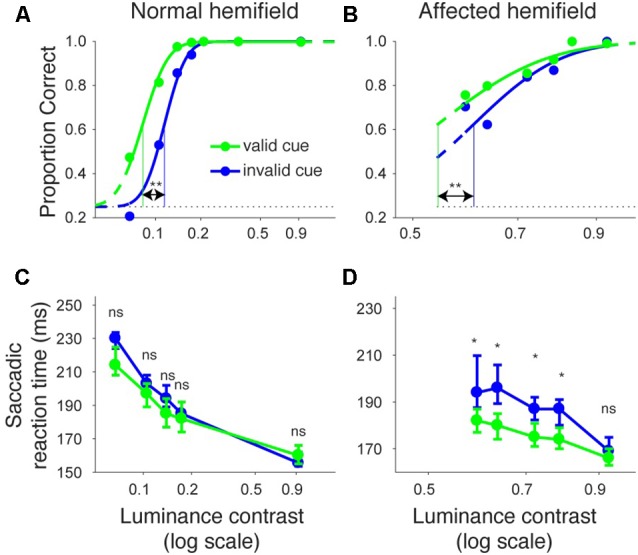
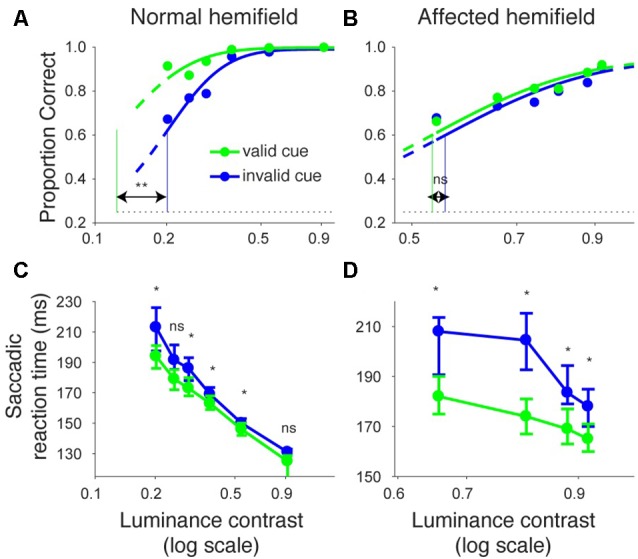
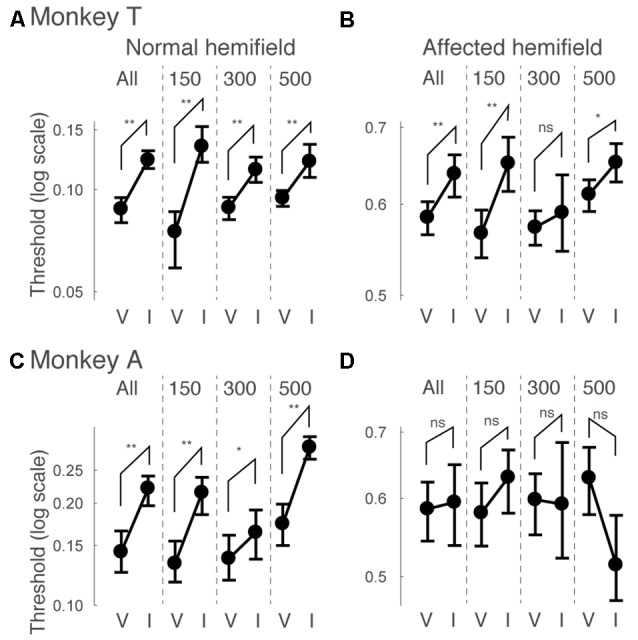
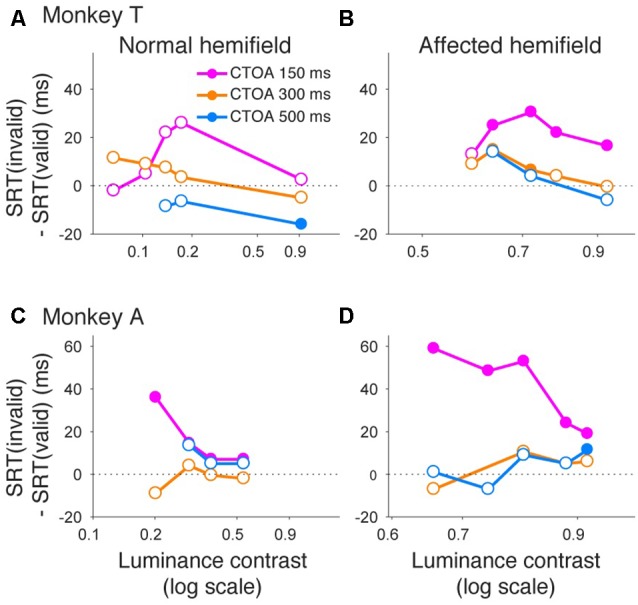
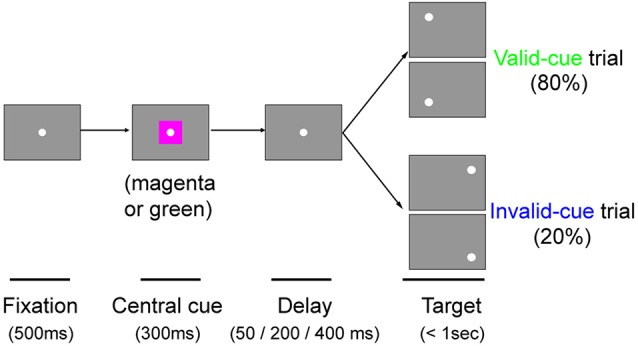
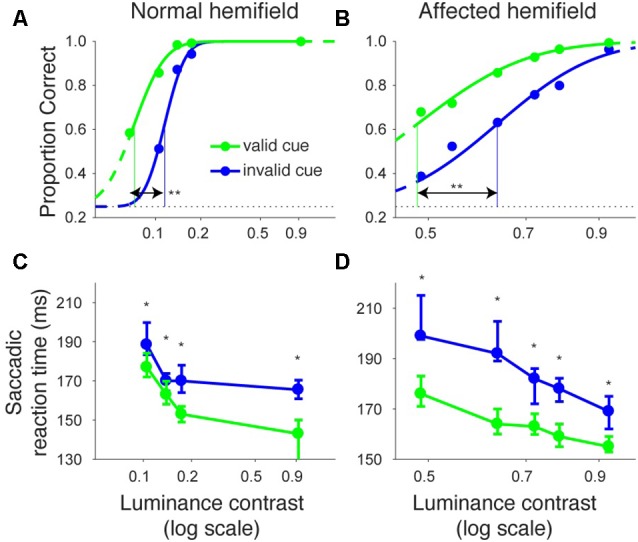
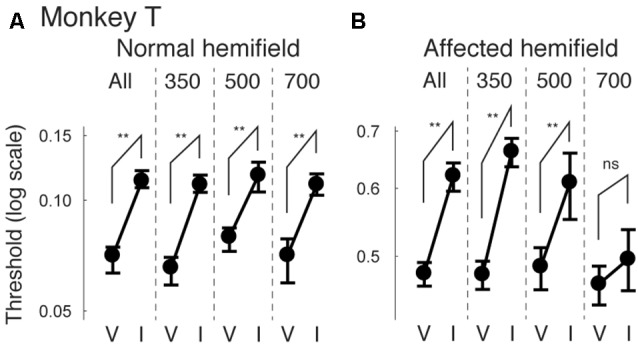
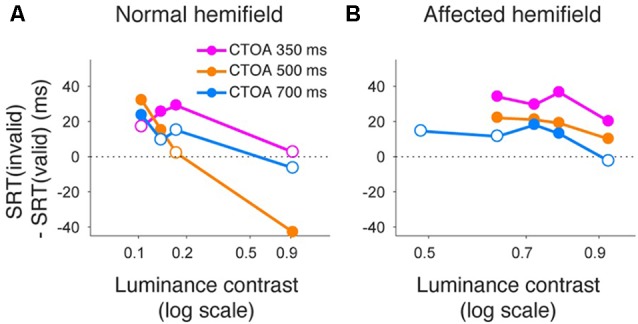
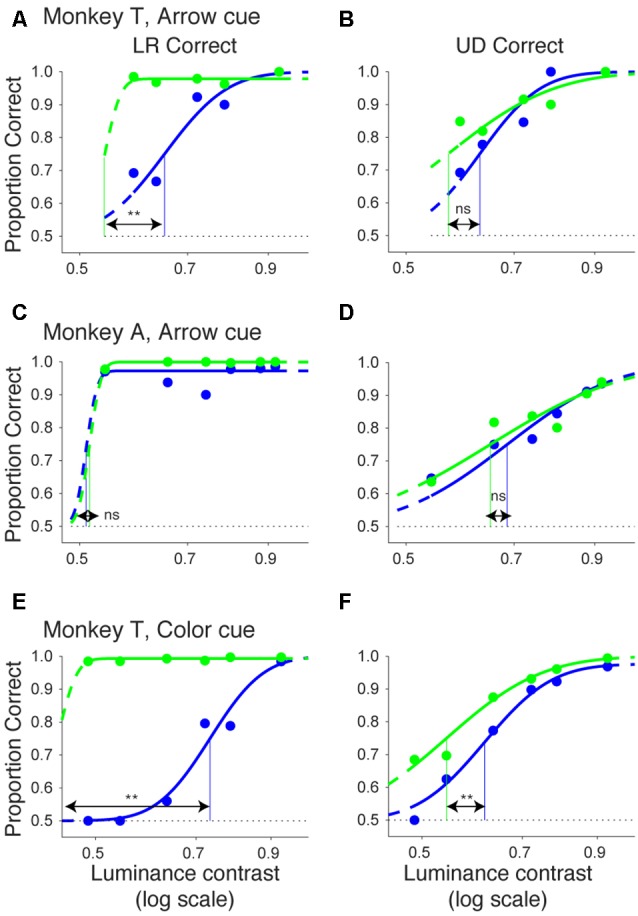
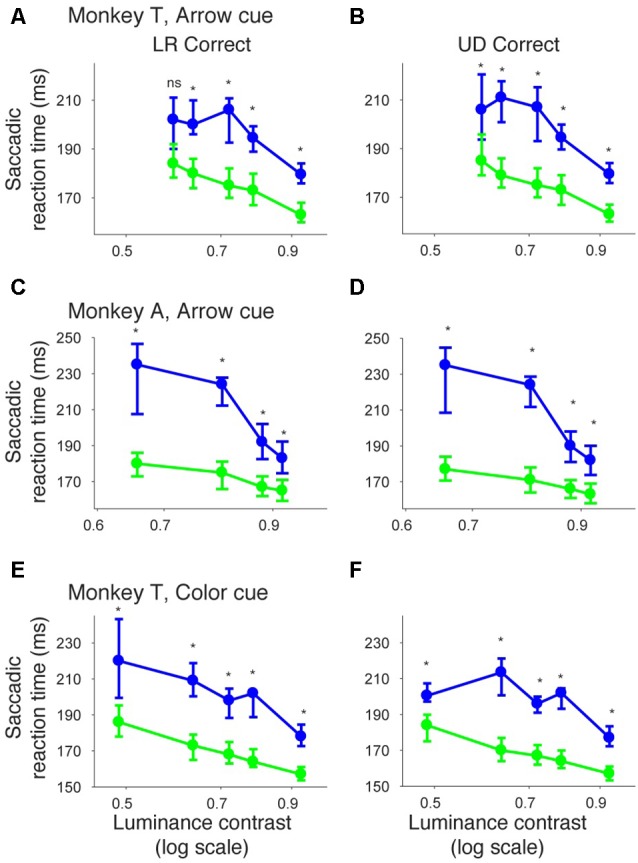
Patients with damage to the primary visual cortex (V1) demonstrate residual visual performance during laboratory tasks despite denying having a conscious percept. The mechanisms behind such performance, often called blindsight, are not fully understood, but the use of surgically-induced unilateral V1 lesions in macaque monkeys provides a useful animal model for exploring such mechanisms. For example, V1-lesioned monkeys localize stimuli in a forced-choice condition while at the same time failing to report awareness of identical stimuli in a yes-no detection condition, similar to human patients. Moreover, residual cognitive processes, including saliency-guided eye movements, bottom-up attention with peripheral non-informative cues, and spatial short-term memory, have all been demonstrated in these animals. Here we examined whether post-lesion residual visuomotor processing can be modulated by top-down task knowledge. We tested two V1-lesioned monkeys with a visually guided saccade task in which we provided an informative foveal pre-cue about upcoming target location. Our monkeys fixated while we presented a leftward or rightward arrow (serving as a pre-cue) superimposed on the fixation point (FP). After various cue-target onset asynchronies (CTOAs), a saccadic target (of variable contrast across trials) was presented either in the affected (contra-lesional) or seeing (ipsi-lesional) hemifield. Critically, target location was in the same hemifield that the arrow pre-cue pointed towards in 80% of the trials (valid-cue trials), making the cue highly useful for task performance. In both monkeys, correct saccade reaction times were shorter during valid than invalid trials. Moreover, in one monkey, the ratio of correct saccades towards the affected hemifield was higher during valid than invalid trials. We replicated both reaction time and correct ratio effects in the same monkey using a symbolic color cue. These results suggest that V1-lesion monkeys can use informative cues to localize stimuli in the contra-lesional hemifield, consistent with reports of a human blindsight subject being able to direct attention in cueing paradigms. Because the superior colliculus (SC) may contribute to residual visual capabilities after V1 lesions, and because this structure is important for controlling attentional resources, we hypothesize that our results reflect, among others, SC involvement in integrating top-down task knowledge for guiding orienting behavior.

Keywords: Posner cueing; blindsight; covert visual attention; eye movements; macaque monkeys.


Figures

Figure 1
Figure 1
The arrow cue task. (A) To illustrate the extent of our primary visual cortex (V1) lesions, 3D images of each monkey’s brain after the lesion procedure were reconstructed from MR images. The lesion site in each animal, estimated from the MR images, is drawn in red. The dotted lines denote the border between V1 and V2. This figure is modified from Figure 1 of Yoshida and Isa (2015), Scientific Reports 5, 10,755. Creative commons (CC BY 4.0). (B) Since both monkeys had a lesion in their left V1, their affected hemifield was on the right side of the screen. (C) Schematic rectangular screens illustrating the fixation point (FP), central cues and saccadic targets for valid and invalid cue trials. Cues were leftward or rightward arrows. Targets were presented at varying intervals (50, 200 or 400 ms) after the briefly flashed cue (100 ms).
Figure 2
Figure 2
Psychometric curves and saccadic reaction times for the arrow cue task (monkey T). (A,B) Dots indicate proportion correct at various luminance contrasts. Data were fitted by psychometric curves (lines). The dots and lines are shown in green for valid cue trials and in blue for invalid cue trial. Horizontal lines indicate chance level performance (0.25 for four alternative forced choice tasks). Vertical lines indicate thresholds for each condition. The threshold was defined as the luminance contrast at which a psychometric curve crossed a value of 0.625 (=(1 + 0.25)/2). **Significantly different (p < 0.01; permutation test). (C,D) Dots indicate median saccadic reaction time at various luminance contrasts. Error bars indicate the 40th and 60th percentiles of the data. Asterisks (p < 0.05) and ns (not significant) indicate results of Wilcoxon’s ranksum test with Bonferroni correction for multiple comparisons. Only data points with more than 10 correct trials were displayed. For both rows, the left column shows data for trials with targets presented in the normal (ipsi-lesional) hemifield (A,C), and the right column shows data for trials with targets presented in the affected (contra-lesional) hemifield (B,D).
Figure 3
Figure 3
Psychometric curves and saccadic reaction times for the arrow cue task (monkey A). This figure uses the same formatting as Figure 2 but shows data for monkey A.
Figure 4
Figure 4
Thresholds for different cue-target onset asynchronies (CTOAs) in the arrow cue task. Thresholds defined for psychometric curves (see the legend of Figure 2 and texts) were compared between valid cue trials (“V”) and invalid cue trials (“I”) for monkey T (A,B) and for monkey A (C,D). Error bars indicate 68% (=1SD) confidence intervals for the thresholds. Four comparisons were plotted in one figure: “All” for data from all CTOAs combined, “150” for data with 150 ms CTOA, “300” for data with 300 ms CTOA and “500” for data with 500 ms CTOA. The left column shows data for trials with targets presented in the normal (ipsi-lesional) hemifield (A,C). The right column shows data for trials with targets presented in the affected (contra-lesional) hemifield (B,D). **p < 0.01, *p < 0.05 and ns (not significant) indicate results of permutation tests for the difference between thresholds for valid and invalid cue trials.
Figure 5
Figure 5
Saccadic reaction times for different CTOAs in the arrow cue task. Differences between median reaction time for invalid cue trials and median reaction time for valid cue trials were plotted across luminance contrasts for monkey T (A,B) and for monkey A (C,D). Data for the normal hemifield (A,C) and for the affected hemifield (B,D) are separately displayed. Colors of the plot denote data for different CTOAs (magenta, 150 ms; orange, 300 ms; light blue, 500 ms). Filled circles indicate statistically significant differences from zero, and open circles indicate non-significant differences (Wilcoxon’s ranksum test with Bonferroni correction for multiple comparisons). In the affected hemifield, both monkeys showed reaction time benefits after pre-cueing, especially in the shortest CTOA. There was also no cost associated with longer CTOAs, as might be expected from inhibition of return (IOR).
Figure 6
Figure 6
The color cue task. Schematic rectangular screens illustrating the FP, central cue and saccadic targets for valid and invalid cue trials. Cues were square patches. A magenta patch predicted left targets with 80% validity. A green patch predicted right targets with 80% validity. Targets were presented at varying intervals (50, 200 or 400 ms) after the briefly flashed cue (300 ms).
Figure 7
Figure 7
Psychometric curves and saccadic reaction times for the color cue task (monkey T). This figure is formatted similarly to Figure 2, but shows data for the color cue task in monkey T.
Figure 8
Figure 8
Thresholds for different CTOAs in the color cue task. Thresholds defined for the psychometric curves of Figures 7A,B were compared between valid cue trials (“V”) and invalid cue trials (“I”) for monkey T (A,B). This figure follows the same conventions as those in Figure 4.
Figure 9
Figure 9
Saccadic reaction times for different CTOAs in the color cue task. Differences between median reaction time for invalid cue trials and median reaction time for valid cue trials were plotted across luminance contrasts for monkey T. This figure follows the same conventions as those in Figure 5. Similar to the arrow cue task, pre-cueing using color symbols in the affected hemifield was again associated with a benefit in reaction time, especially for the shortest CTOA.
Figure 10
Figure 10
Bias vs. sensitivity for psychometric curves in the arrow and color cue tasks. As variants of psychometric curves, two different kinds of proportion correct were calculated and plotted across luminance contrasts for the arrow cue task in monkey T (A,B), for the arrow cue task in monkey A (C,D), and for the color cue task in monkey T (E,F). In the left column (A,C,E), proportion correct for left-right choice irrespective of up-down choice was calculated (“LR correct”). In the right column (B,D,F), proportion correct for up-down choice irrespective of left-right choice was calculated (“UD correct”). The data were fitted by cumulative Gaussian functions (lines). The dots and lines are shown in green for valid cue trials and in blue for invalid cue trial. Horizontal lines indicate chance level performance (0.5 for two alternative forced choice tasks). Vertical lines indicate thresholds for each condition. The threshold was defined as the luminance contrast at which a psychometric curve crossed a value of 0.75 (=(1 + 0.5)/2).
Figure 11
Figure 11
Bias vs. sensitivity for saccadic reaction times in the arrow and color cue tasks. Median reaction time for “LR correct” trials (the left column) and “UD correct” trials (the right column) were plotted across luminance contrasts for the arrow cue task in monkey T (A,B), for the arrow cue task in monkey A (C,D), and for the color cue task in monkey T (E,F). The dots and lines are shown in green for valid cue trials and in blue for invalid cue trial. Error bars denote the 40th and 60th percentiles of the data.

References

    1. Aizawa H., Wurtz R. H. (1998). Reversible inactivation of monkey superior colliculus. I. Curvature of saccadic trajectory. J. Neurophysiol. 79, 2082–2096. - PubMed
    1. Bell A. H., Munoz D. P. (2008). Activity in the superior colliculus reflects dynamic interactions between voluntary and involuntary influences on orienting behaviour. Eur. J. Neurosci. 28, 1654–1660. 10.1111/j.1460-9568.2008.06393.x - DOI - PubMed
    1. Bowman E. M., Brown V. J., Kertzman C., Schwarz U., Robinson D. L. (1993). Covert orienting of attention in macaques. I. Effects of behavioral context. J. Neurophysiol. 70, 431–443. - PubMed
    1. Cameron E. L., Tai J. C., Carrasco M. (2002). Covert attention affects the psychometric function of contrast sensitivity. Vision Res. 42, 949–967. 10.1016/S0042-6989(02)00039-1 - DOI - PubMed
    1. Campion J., Latto R., Smith Y. M. (1983). Is blindsight an effect of scattered light, spared cortex and near-threshold vision? Behav. Brain Sci. 6, 423–448. 10.1017/s0140525x00016861 - DOI