

Reliable measurement of E. coli single cell fluorescence distribution using a standard microscope set-up
- PMID: 28239411
- PMCID: PMC5317050
- DOI: 10.1186/s13036-017-0050-y
Reliable measurement of E. coli single cell fluorescence distribution using a standard microscope set-up
Abstract
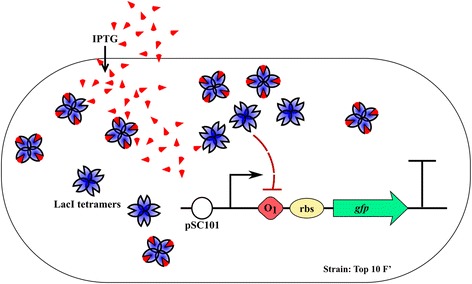
Background: Quantifying gene expression at single cell level is fundamental for the complete characterization of synthetic gene circuits, due to the significant impact of noise and inter-cellular variability on the system's functionality. Commercial set-ups that allow the acquisition of fluorescent signal at single cell level (flow cytometers or quantitative microscopes) are expensive apparatuses that are hardly affordable by small laboratories.
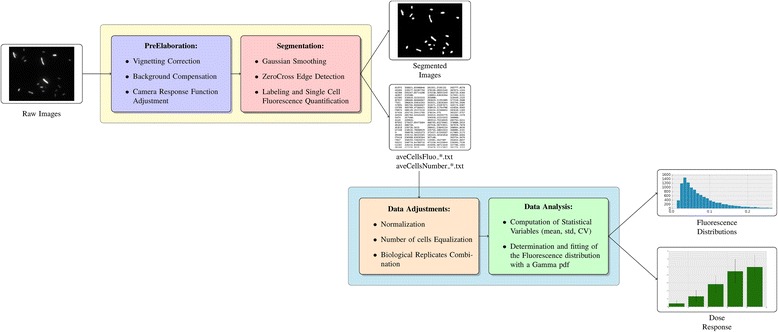
Methods: A protocol that makes a standard optical microscope able to acquire quantitative, single cell, fluorescent data from a bacterial population transformed with synthetic gene circuitry is presented. Single cell fluorescence values, acquired with a microscope set-up and processed with custom-made software, are compared with results that were obtained with a flow cytometer in a bacterial population transformed with the same gene circuitry.
Results: The high correlation between data from the two experimental set-ups, with a correlation coefficient computed over the tested dynamic range > 0.99, proves that a standard optical microscope- when coupled with appropriate software for image processing- might be used for quantitative single-cell fluorescence measurements. The calibration of the set-up, together with its validation, is described.
Conclusions: The experimental protocol described in this paper makes quantitative measurement of single cell fluorescence accessible to laboratories equipped with standard optical microscope set-ups. Our method allows for an affordable measurement/quantification of intercellular variability, whose better understanding of this phenomenon will improve our comprehension of cellular behaviors and the design of synthetic gene circuits. All the required software is freely available to the synthetic biology community (MUSIQ Microscope flUorescence SIngle cell Quantification).
Keywords: Fluorescence microscopy; Phenotypic noise; Single-cell fluorescence; Synthetic biology.
Figures


Similar articles
-
A flow cytometer designed for fluorescence calibration.Cytometry. 1998 Oct 1;33(2):280-7. doi: 10.1002/(sici)1097-0320(19981001)33:2<280::aid-cyto25>3.0.co;2-p. Cytometry. 1998. PMID: 9773891
-
An automated protocol for performance benchmarking a widefield fluorescence microscope.Cytometry A. 2014 Nov;85(11):978-85. doi: 10.1002/cyto.a.22519. Epub 2014 Aug 13. Cytometry A. 2014. PMID: 25132217
-
A new multiparameter flow cytometer: optical and electrical cell analysis in combination with video microscopy in flow.Cytometry. 1999 Apr 1;35(4):291-301. doi: 10.1002/(sici)1097-0320(19990401)35:4<291::aid-cyto1>3.0.co;2-y. Cytometry. 1999. PMID: 10213194
-
Ongoing development of image cytometers.Bioanalysis. 2010 Oct;2(10):1755-65. doi: 10.4155/bio.10.119. Bioanalysis. 2010. PMID: 21083327 Review.
-
Phenotypic Variability in Synthetic Biology Applications: Dealing with Noise in Microbial Gene Expression.Front Microbiol. 2016 Apr 8;7:479. doi: 10.3389/fmicb.2016.00479. eCollection 2016. Front Microbiol. 2016. PMID: 27092132 Free PMC article. Review.
Cited by
-
Rapid detection of Escherichia coli using bacteriophage-induced lysis and image analysis.PLoS One. 2020 Jun 5;15(6):e0233853. doi: 10.1371/journal.pone.0233853. eCollection 2020. PLoS One. 2020. PMID: 32502212 Free PMC article.
-
Non-destructive monitoring of 3D cell cultures: new technologies and applications.PeerJ. 2022 May 12;10:e13338. doi: 10.7717/peerj.13338. eCollection 2022. PeerJ. 2022. PMID: 35582620 Free PMC article. Review.
-
Density Distribution Maps: A Novel Tool for Subcellular Distribution Analysis and Quantitative Biomedical Imaging.Sensors (Basel). 2021 Feb 2;21(3):1009. doi: 10.3390/s21031009. Sensors (Basel). 2021. PMID: 33540807 Free PMC article.
-
Perfusion Flow Enhances Viability and Migratory Phenotype in 3D-Cultured Breast Cancer Cells.Ann Biomed Eng. 2021 Sep;49(9):2103-2113. doi: 10.1007/s10439-021-02727-w. Epub 2021 Feb 4. Ann Biomed Eng. 2021. PMID: 33543395 Free PMC article.
References
-
- Bandiera L, Pasini A, Pasotti L, Zucca S, Mazzini G, Magni P, Giordano E, Furini S. Experimental measurement and mathematical modeling of biological noise arising from transcriptional and translational regulation of basic synthetic gene-circuits. J Theor Biol. 2016;395:153–160. doi: 10.1016/j.jtbi.2016.02.004. - DOI - PubMed
LinkOut - more resources
Full Text Sources
Other Literature Sources
