

New rapid, accurate T2 quantification detects pathology in normal-appearing brain regions of relapsing-remitting MS patients
- PMID: 28239545
- PMCID: PMC5318543
- DOI: 10.1016/j.nicl.2017.01.029
New rapid, accurate T2 quantification detects pathology in normal-appearing brain regions of relapsing-remitting MS patients
Abstract
Introduction: Quantitative T2 mapping may provide an objective biomarker for occult nervous tissue pathology in relapsing-remitting multiple sclerosis (RRMS). We applied a novel echo modulation curve (EMC) algorithm to identify T2 changes in normal-appearing brain regions of subjects with RRMS (N = 27) compared to age-matched controls (N = 38).
Methods: The EMC algorithm uses Bloch simulations to model T2 decay curves in multi-spin-echo MRI sequences, independent of scanner, and scan-settings. T2 values were extracted from normal-appearing white and gray matter brain regions using both expert manual regions-of-interest and user-independent FreeSurfer segmentation.
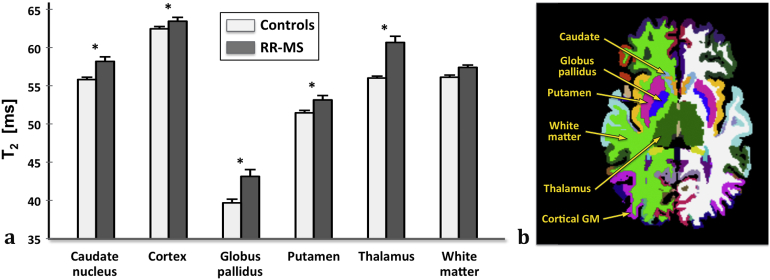
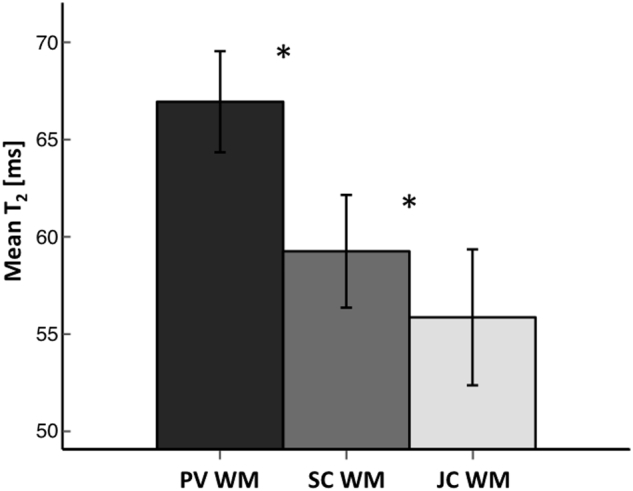
Results: Compared to conventional exponential T2 modeling, EMC fitting provided more accurate estimations of T2 with less variance across scans, MRI systems, and healthy individuals. Thalamic T2 was increased 8.5% in RRMS subjects (p < 0.001) and could be used to discriminate RRMS from healthy controls well (AUC = 0.913). Manual segmentation detected both statistically significant increases (corpus callosum & temporal stem) and decreases (posterior limb internal capsule) in T2 associated with RRMS diagnosis (all p < 0.05). In healthy controls, we also observed statistically significant T2 differences for different white and gray matter structures.
Conclusions: The EMC algorithm precisely characterizes T2 values, and is able to detect subtle T2 changes in normal-appearing brain regions of RRMS patients. These presumably capture both axon and myelin changes from inflammation and neurodegeneration. Further, T2 variations between different brain regions of healthy controls may correlate with distinct nervous tissue environments that differ from one another at a mesoscopic length-scale.
Keywords: AUC, area under the curve; B1 +, transmit field; Biomarkers; Demyelination; EMC, echo modulation curve; FLAIR, fluid-attenuated inversion recovery; GM, gray matter; MPRAGE, magnetization-prepared rapid gradient-echo; MSE, multi-spin echo; MWF, myelin water fraction; Mesoscopic; Neurodegeneration; ROI, Region of Interest; RRMS, relapsing-remitting multiple sclerosis; Relaxation; SPACE, sampling perfection with application-optimized contrasts using different flip angle evolution; SSE, single spin echo; WM, white matter.
Figures


References
-
- Alonso-Ortiz E., Levesque I.R., Pike G.B. MRI-based myelin water imaging: a technical review. Magn. Reson. Med. 2015;73(1):70–81. - PubMed
-
- Barkhof F. The clinico-radiological paradox in multiple sclerosis revisited. Curr. Opin. Neurol. 2002;15(3):239–245. - PubMed
-
- Barnett M.H., Prineas J.W. Relapsing and remitting multiple sclerosis: pathology of the newly forming lesion. Ann. Neurol. 2004;55(4):458–468. - PubMed
-
- Ben-Eliezer N., Cosi V., Yoshimoto E.A., Sodickson D.K., Bruno M., Block K.T., Shepherd T. Identification of quantitative differences in normal-appearing white matter of multiple sclerotic patients vs. healthy controls using a novel Bloch-simulation-based T2 mapping technique. Proc. Int. Soc. Magn. Reson. Med. 2015;23:4364. (unpublished material available as supplementary material)
Publication types
MeSH terms
Grants and funding
LinkOut - more resources
Full Text Sources
Other Literature Sources
Medical
