. 2017 Feb 23;2(4):e87489.
doi: 10.1172/jci.insight.87489.

Mammary adipocytes stimulate breast cancer invasion through metabolic remodeling of tumor cells

Affiliations

Mammary adipocytes stimulate breast cancer invasion through metabolic remodeling of tumor cells

Yuan Yuan Wang et al. JCI Insight. .

Abstract

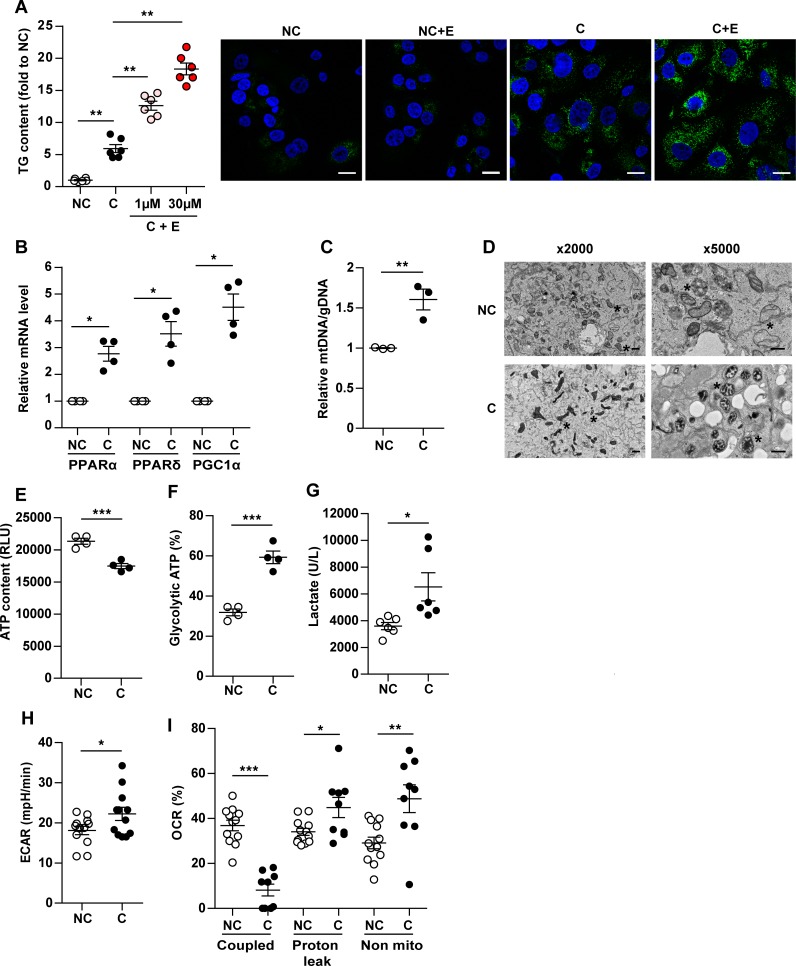
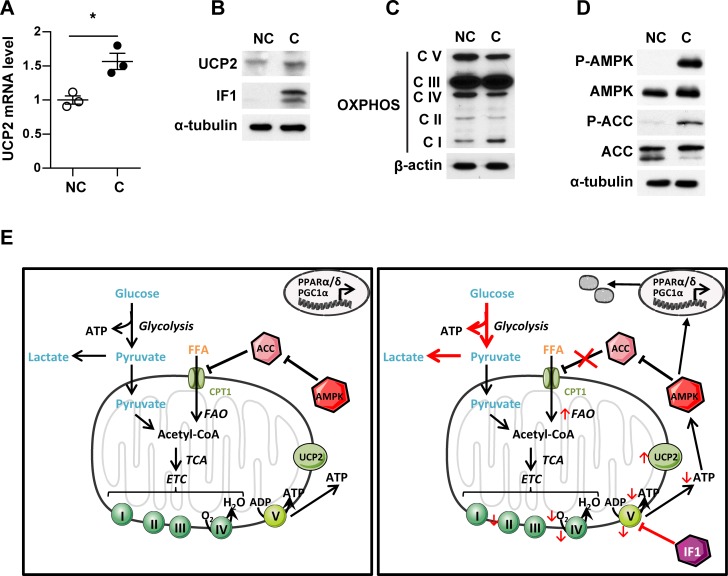
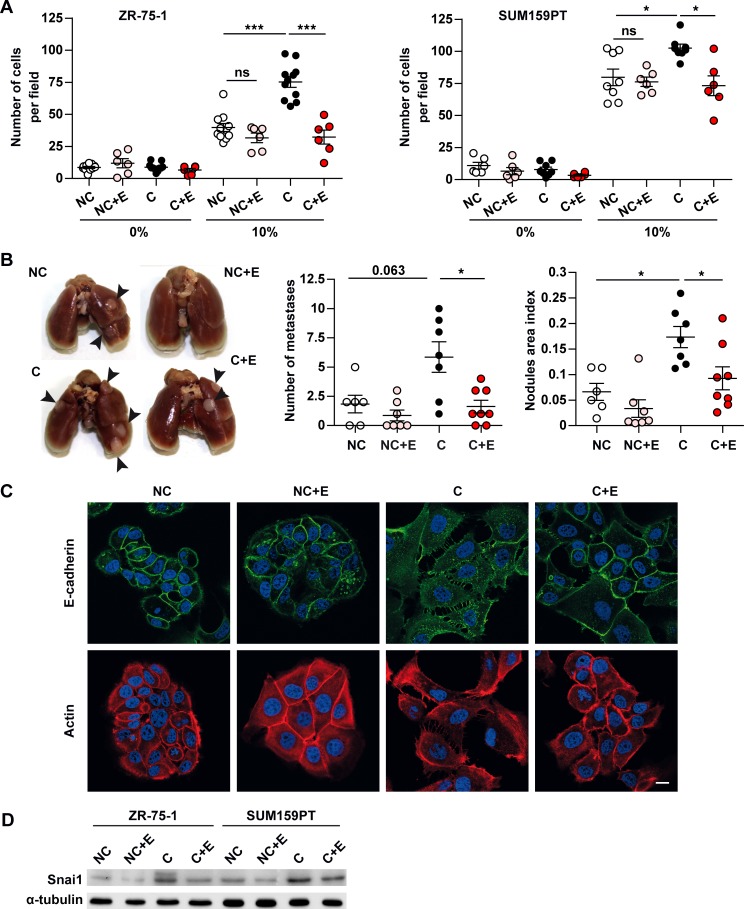
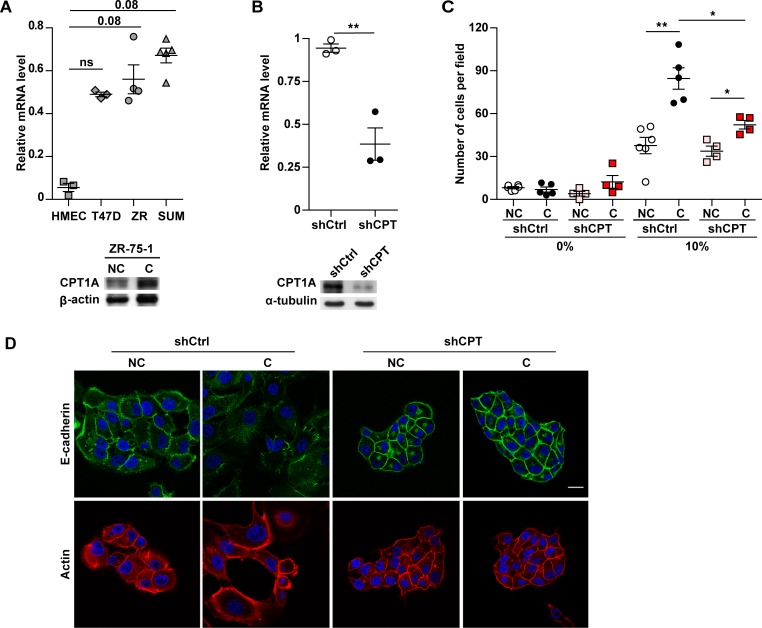
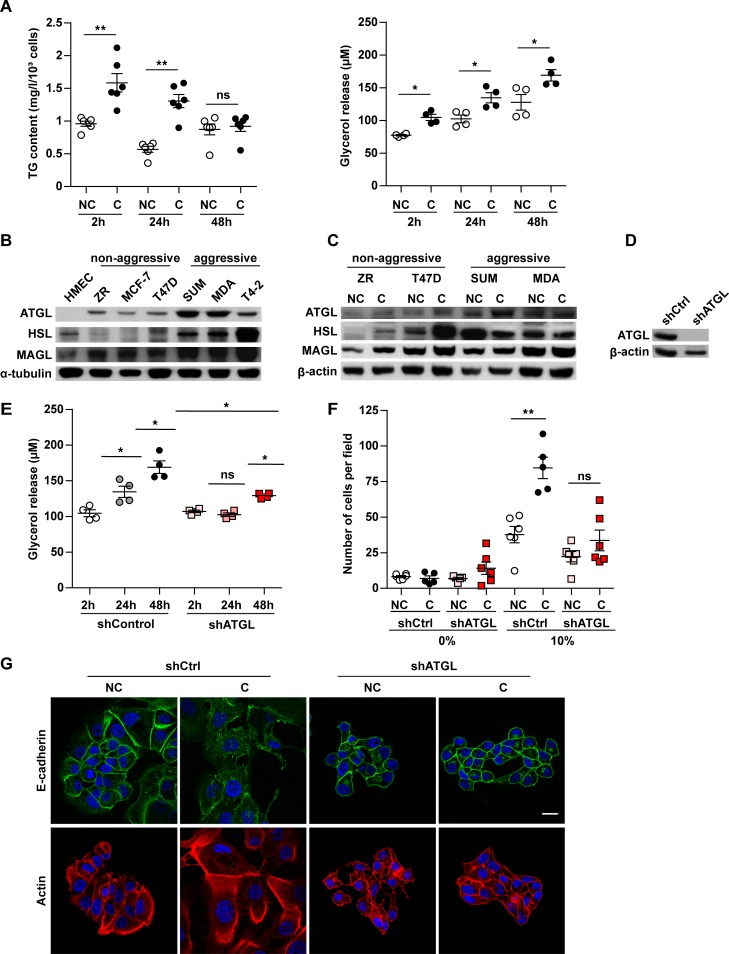
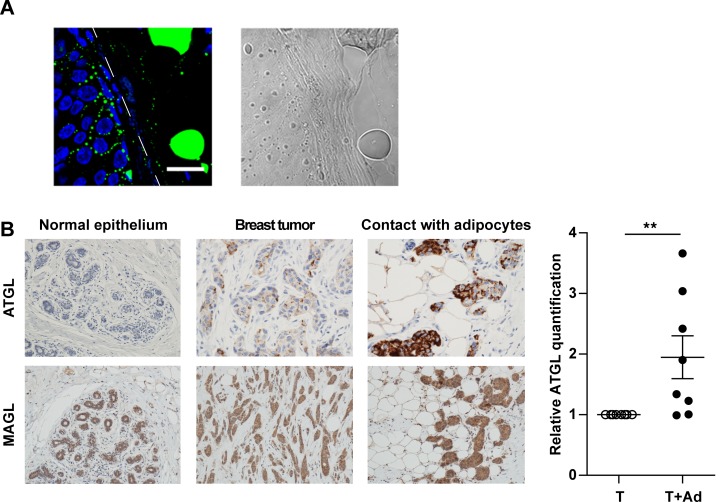
In breast cancer, a key feature of peritumoral adipocytes is their loss of lipid content observed both in vitro and in human tumors. The free fatty acids (FFAs), released by adipocytes after lipolysis induced by tumor secretions, are transferred and stored in tumor cells as triglycerides in lipid droplets. In tumor cell lines, we demonstrate that FFAs can be released over time from lipid droplets through an adipose triglyceride lipase-dependent (ATGL-dependent) lipolytic pathway. In vivo, ATGL is expressed in human tumors where its expression correlates with tumor aggressiveness and is upregulated by contact with adipocytes. The released FFAs are then used for fatty acid β-oxidation (FAO), an active process in cancer but not normal breast epithelial cells, and regulated by coculture with adipocytes. However, in cocultivated cells, FAO is uncoupled from ATP production, leading to AMPK/acetyl-CoA carboxylase activation, a circle that maintains this state of metabolic remodeling. The increased invasive capacities of tumor cells induced by coculture are completely abrogated by inhibition of the coupled ATGL-dependent lipolysis/FAO pathways. These results show a complex metabolic symbiosis between tumor-surrounding adipocytes and cancer cells that stimulate their invasiveness, highlighting ATGL as a potential therapeutic target to impede breast cancer progression.


Conflict of interest statement

Conflict of interest: The authors have declared that no conflict of interest exists.

Figures

Figure 1
Figure 1. A lipid transfer occurs between adipocytes and cancer cells, which in turn exhibit increased fatty acid oxidation (FAO).
(A) Left, lipid accumulation in ZR-75-1 cells cultured alone (NC) or with 3T3-F442A mature adipocytes (C) for 3 days (cells were stained with Bodipy [lipids in green and nuclear counterstaining in blue], left panel or red oil, right panel). Right, triglyceride (TG) content dosed in ZR-75-1 cells cocultivated or not with adipocytes (n = 5). (B) Lipid accumulation in SUM159PT cocultivated or not with adipocytes, shown after staining with Bodipy (left) or by measure of TG content (right) (n = 6). (A and B) At least 3 experiments were conducted, and representative experiments are shown. Scale bars: 20 μm. (C) Mature adipocytes were treated or not (NT) with conditioned medium (CM) from either human mammary epithelial cells (HMEC) or breast tumor cells (ZR, ZR-75-1; SUM, SUM159PT) for 3 days. Cell supernatants were collected, and free glycerol release was measured (n = 3–6). (D) Radiolabeled mature adipocytes obtained from in vitro differentiation of 3T3-F442A preadipocytes in the presence of [14C] palmitate were cocultivated or not with ZR-75-1 tumor cells for 3 and 5 days. The radioactive content (disintegrations per minute [dpm]) was measured in adipocytes or tumor cells (n = 3–4). (E) Complete (left panel, n = 10–18) and incomplete (middle panel, n = 9–23) FAO in HMEC and indicated tumor cells cultured alone or with adipocytes (the myoblast cell line C2C12 was used as a positive control). The ratio between complete to incomplete FAO is shown (right panel, n = 7–12). Bars and error flags represent means ± SEM; statistically significant by Student’s t test (A and B) or Mann-Whitney U test (CE), *P < 0.05, **P < 0.01, ***P < 0.001.
Figure 2
Figure 2. In the presence of adipocytes, breast cancer cells undergo a metabolic switch toward uncoupled mitochondrial fatty acid oxidation (FAO).
ZR-75-1 cells were cocultivated (C) or not (NC) with adipocytes for 3 days. (A) Lipid accumulation in tumor cells in the presence (+E) or not of Etomoxir (1 μM and 30 μM). Left, triglycerides (TG) content (n = 6). Right, lipid staining with Bodipy in green and DAPI in blue. Etomoxir (30 μM). Scale bars: 30μm. (B) Expression of the indicated genes measured by qPCR in tumor cells (n = 4). (C) Mitochondrial DNA (ratio of mitochondrial [mtDNA] to genomic [gDNA] DNA levels) levels in tumor cells (n = 3). (D) Representative experiments of transmission electron microscopy highlighting mitochondrial ultra-structural changes (*) in C or NC. Scale bars: 1 μm and 2 μm. (A and D) At least 3 experiments were conducted, and representative images are shown. (E) Total ATP production in tumor cells (n = 4). (F) ATP generated by glycolysis in tumor cells (n = 4). (G) Lactate released by tumor cells (n = 6). (H) Extracellular acidification rate (ECAR) evaluated after addition of 10 mM glucose to tumor cells (n = 12). (I) Oxygen consumption rate (OCR) was measured in the presence of palmitate and coupled respiration, proton leak and nonmitochondrial respiration were calculated as described in Methods (n = 9–12). Bars and error flags represent means ± SEM; statistically significant by Mann-Whitney U test (A, B and I) or Student’s t test (CH), *P < 0.05, **P < 0.01, ***P < 0.001.
Figure 3
Figure 3. Peritumoral adipocytes induce a metabolic remodeling in favor of uncoupled fatty acid oxidation (FAO).
ZR-75-1 cells were cocultivated (C) or not (NC) with adipocytes for 3 days. (A) Quantification of UCP2 mRNA levels (n = 3). (B) UCP2 and inhibitory factor 1 (IF1) expression evaluated by Western blot. α-Tubulin is used as a loading control. (C) Expression of mitochondrial oxidative phosphorylation (OXPHOS) complexes evaluated by Western blot. Actin is shown as a control for equal protein loading. (D) Expression of total and phosphorylated forms of the acetyl-CoA carboxylase (ACC) and AMPK. α-Tubulin is used as a loading control. (BD) At least 3 experiments were conducted, and representative experiments are shown. (E) Schematic representation of the metabolic remodeling, which takes place in tumor cells in the presence of adipocytes. Bars and error flags represent means ± SEM; statistically significant by Student’s t test, *P < 0.05.
Figure 4
Figure 4. The metabolic crosstalk between adipocytes and breast cancer cells contributes to epithelial to mesenchymal transition (EMT) and increases tumor invasion.
(A) ZR-75-1 or SUM159PT cells were grown for 3 days on Transwells in the presence (C) or not (NC) of adipocytes and treated or not with Etomoxir (+E). After 3 days, cells were used for Matrigel invasion assays against medium containing either 0% or 10% FCS (n = 6–11). (B) BALB/c mice were inoculated with murine breast cancer TS/A cells cultured in the presence or absence of adipocytes and treated or not with 30 μM Etomoxir (+E) for 3 days prior to tail vein injection. Left, representative image of lungs from each group harvested at necropsy. The nodules present at the surface of the lungs are indicated by arrows. Right, quantification of the number and area of tumor nodules for each group of mice. NC, n = 6; NC + E, n = 7; C, n = 7; C + E, n = 8. (C) ZR-75-1 cells were grown for 3 days on coverslips in inserts in the presence or not of mature adipocytes and treated or not with Etomoxir (+E). After 3 days, cells were fixed, and the indicated proteins were detected by immunofluorescence. Nuclei were labeled with DAPI. Scale bar: 20μm. (D) Western blot of SNAI1 in ZR-75-1 and SUM159PT cells incubated in similar conditions. (C and D) At least 3 experiments were conducted, and representative experiments are shown. Bars and error flags represent means ± SEM; statistically significant by Mann-Whitney U test (A and B), *P < 0.05, ***P < 0.001.
Figure 5
Figure 5. Downregulation of carnitine palmitoyltransferase 1A (CPT1A) expression in breast cancer cells inhibits the increased invasion and epithelial to mesenchymal transition (EMT) induced by adipocytes.
(A) Upper panel: relative CPT1A mRNA expression in human mammary epithelial cells (HMEC) and in the indicated breast tumor cell lines (ZR: ZR-75-1; SUM: SUM159PT) (n = 3–5). Lower panel: expression of CPT1A analyzed by immunoblot in ZR-75-1 cells cocultivated (C) or not (NC) with mature adipocytes for 3 days. (B) Quantification of the mRNA (upper panel, n = 3) and protein levels (lower panel) of CPT1A in ZR-75-1 cells stably transfected with shControl (shCtrl) and shCPT1A (shCPT) vectors. (C) ZR-75-1 cells stably transfected with shCtrl and shCPT were grown on Transwells in the presence or not of mature adipocytes. After 3 days, cells were used for Matrigel invasion assays toward a medium containing either 0% or 10% FCS (n = 4–6). (D) Immunofluorescence staining, visualized by confocal microscopy, of E-cadherin (green) and Actin (red) in shControl and shCPT1A ZR-75-1 cells cocultivated or not with adipocytes for 3 days. Nuclei were labeled with DAPI. Scale bar: 20 μm. (A, B, and D) At least 3 experiments were conducted, and representative experiments are shown. Bars and error flags represent means ± SEM; statistically significant by Mann-Whitney U test (A and C) and Student’s t test (B), *P < 0.05, **P < 0.01.
Figure 6
Figure 6. Breast cancer cells possess an adipose triglyceride lipase–dependent (ATGL-dependent) lipolytic pathway that favors cancer aggressiveness in the presence of adipocytes.
(A) ZR-75-1 cells were cocultivated (C) or not (NC) with adipocytes for 3 days. Then, at indicated times after adipocyte removal, tumor cell TG content (left, n = 6) and the glycerol release (right, n = 4) were measured. (B) ATGL, HSL (Hormone-Sensitive Lipase), and MAGL (monoacylglycerol lipase) protein levels were analyzed in human mammary epithelial cells (HMEC), nonaggressive (ZR, MCF-7, and T47D), and aggressive breast tumor cells (SUM, MDA, and T4-2) by Western blot (MDA, MDA-MB-231; T4-2, HMT-3522-T4-2). (C) Similar experiments performed in tumor cells cocultivated (C) or not (NC) with adipocytes for 3 days. (D) ATGL protein levels analyzed in ZR-75-1 cells transfected with shControl (shCtrl) or shATGL vectors. (E) Glycerol content measured in the medium of ZR-75-1 tumor cells transfected with shControl or shATGL vectors and cocultivated in the presence of adipocytes for 3 days (n = 4). (F) ZR-75-1 cells stably transfected with shControl or shATGL were cocultivated or not with adipocytes. After 3 days, cells were used for matrigel invasion assays in a medium containing either 0% or 10% FCS (n = 5–6). (G) Staining of E-cadherin (green) and Actin (red) by immunofluorescence in these cells. Nuclei were labeled with DAPI. Scale bar: 20 μm. (BD and G) At least 3 experiments were conducted, and representative experiments are shown. Bars and error flags represent means ± SEM; statistically significant by Mann-Whitney U test, *P < 0.05, **P < 0.01.
Figure 7
Figure 7. Breast cancer cells accumulate lipids and present upregulated adipose triglyceride lipase (ATGL) expression at close proximity to adipocytes.
(A) Left, representative staining of lipid accumulation (detected by bodipy, in green) at the invasive front of a human breast tumor sample. The interface between breast cancer cells and adipocytes is indicated by a white dashed line. Scale bar: 20 μm. Nuclei were labeled with DAPI. Right, phase contrast light microscopy observation of the same sample. (B) Left, representative immunohistochemical staining of ATGL and MAGL (monoacylglycerol lipase; in brown) in human samples, with hematoxylin counter-staining. A representative staining obtained in normal breast epithelium (objective 20×), in breast tumors and in areas where breast tumors are in contact with adipocytes (objective 40×), is shown. Right, quantification of ATGL in human tumors where tumor cells are in contact with adipocytes (T + Ad) or not (T) (n = 8). Bars and error flags represent means ± SEM; statistically significant by Student’s t test, **P < 0.01.
Figure 8
Figure 8. Tumor-surrounding adipocytes promote a metabolic remodeling in breast cancer cells, leading to increased aggressiveness.
Tumor secretions induce a lipolytic process in surrounding adipocytes, which then become cancer-associated adipocytes (CAA). The large quantities of free fatty acids (FFAs) released after adipocyte activation are uptaken and stored as triglycerides (TG) by cancer cells. In these cells, adipose triglyceride lipase (ATGL) overexpression activates a lipolytic process, leading to the release of FFA from lipids droplets and their translocation into mitochondria via the carnitine palmitoyltransferase 1A (CPT1A). The massive influx of lipids induces uncoupled fatty acid oxidation (FAO), characterized by uncoupling protein 2 (UCP2) and inhibitory factor 1 (IF1) overexpression and decreased ATP levels. The reduced ATP content activates AMPK, which promotes both mitochondrial biogenesis and FFA uptake into mitochondria via the acetyl-CoA carboxylase (ACC) inhibition. This circle maintains the metabolic remodeling of tumor cells and increases their aggressiveness.

References

    1. Marusyk A, Polyak K. Tumor heterogeneity: causes and consequences. Biochim Biophys Acta. 2010;1805(1):105–117. - PMC - PubMed
    1. Hanahan D, Weinberg RA. Hallmarks of cancer: the next generation. Cell. 2011;144(5):646–674. doi: 10.1016/j.cell.2011.02.013. - DOI - PubMed
    1. Koppenol WH, Bounds PL, Dang CV. Otto Warburg’s contributions to current concepts of cancer metabolism. Nat Rev Cancer. 2011;11(5):325–337. doi: 10.1038/nrc3038. - DOI - PubMed
    1. Kroemer G, Pouyssegur J. Tumor cell metabolism: cancer’s Achilles’ heel. Cancer Cell. 2008;13(6):472–482. doi: 10.1016/j.ccr.2008.05.005. - DOI - PubMed
    1. Jose C, Bellance N, Rossignol R. Choosing between glycolysis and oxidative phosphorylation: a tumor’s dilemma? Biochim Biophys Acta. 2011;1807(6):552–561. - PubMed

Publication types

MeSH terms