. 2017 Feb 23;2(4):e89044.
doi: 10.1172/jci.insight.89044.

Switching harmful visceral fat to beneficial energy combustion improves metabolic dysfunctions

Affiliations

Switching harmful visceral fat to beneficial energy combustion improves metabolic dysfunctions

Xiaoyan Yang et al. JCI Insight. .

Abstract

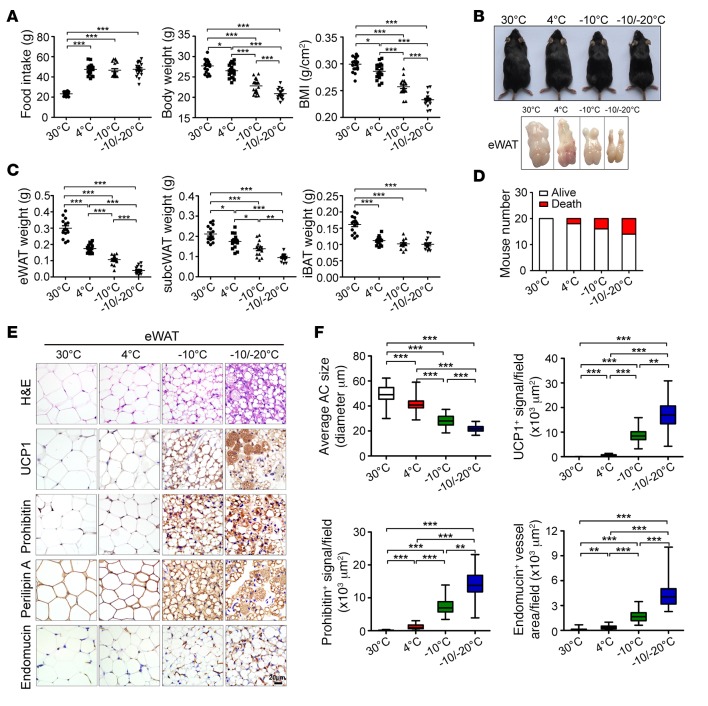
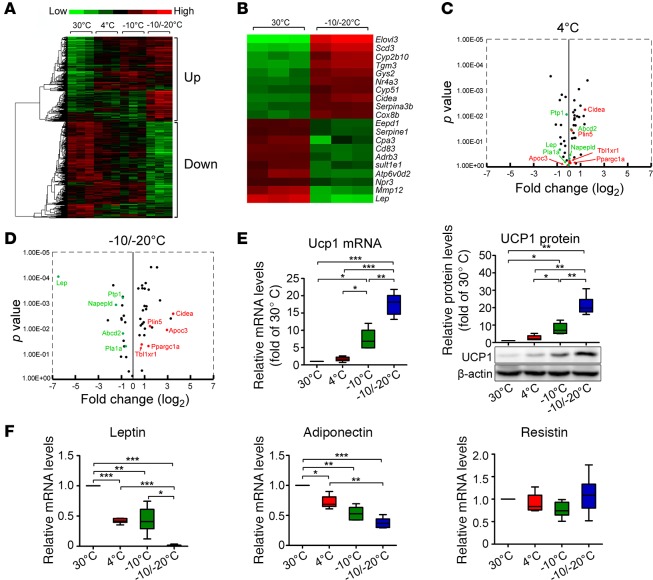
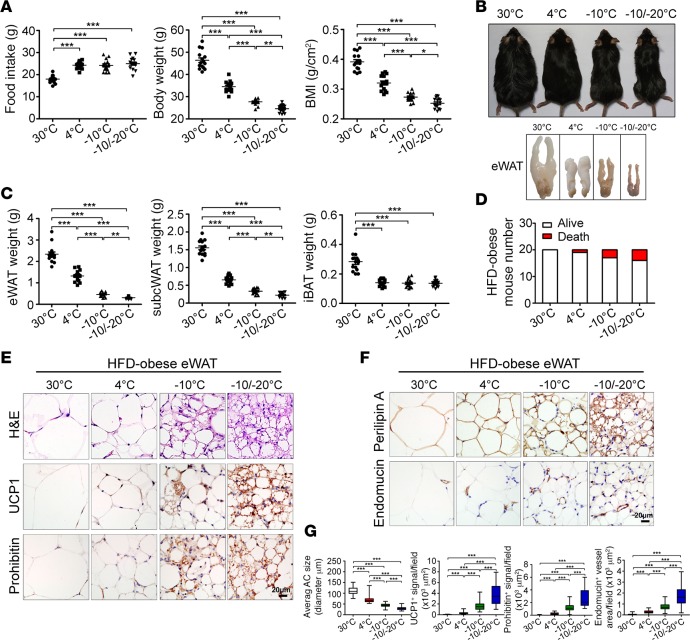
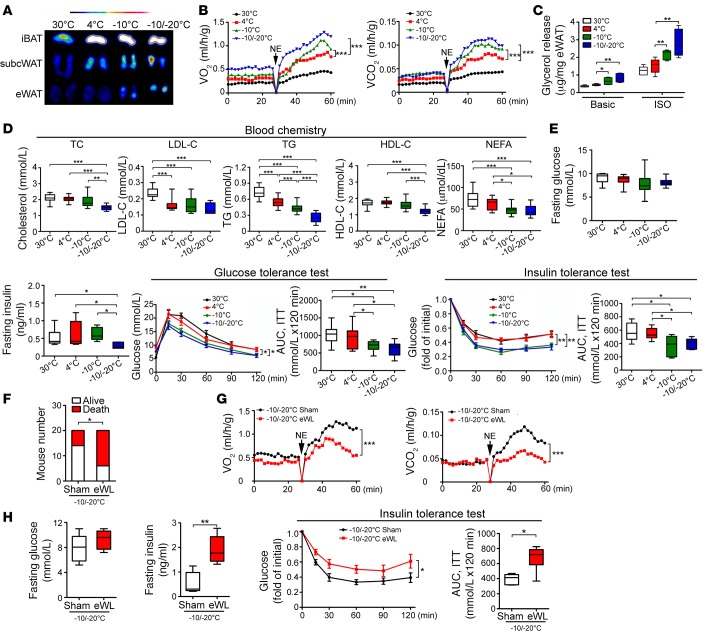
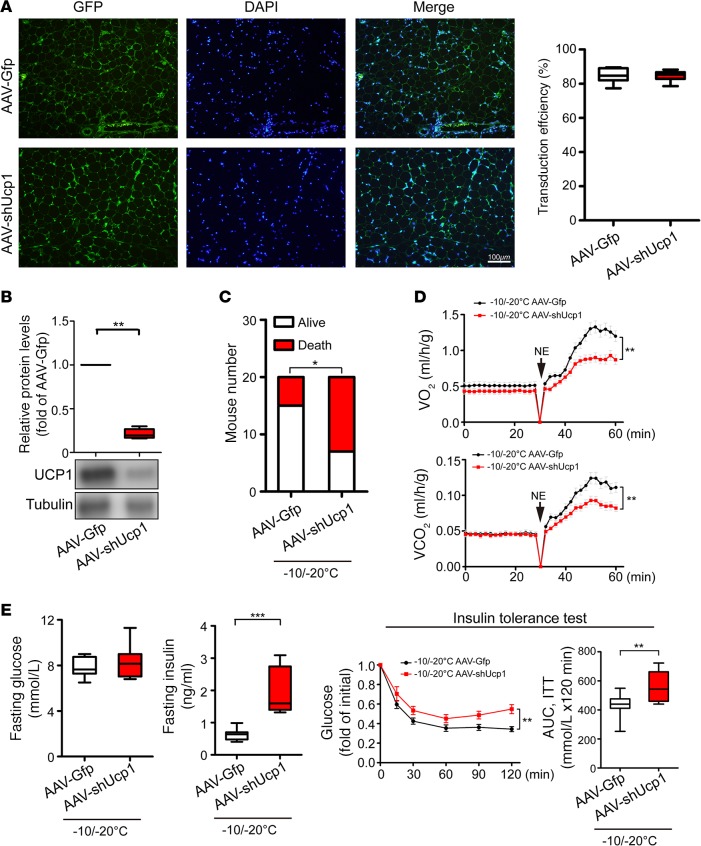
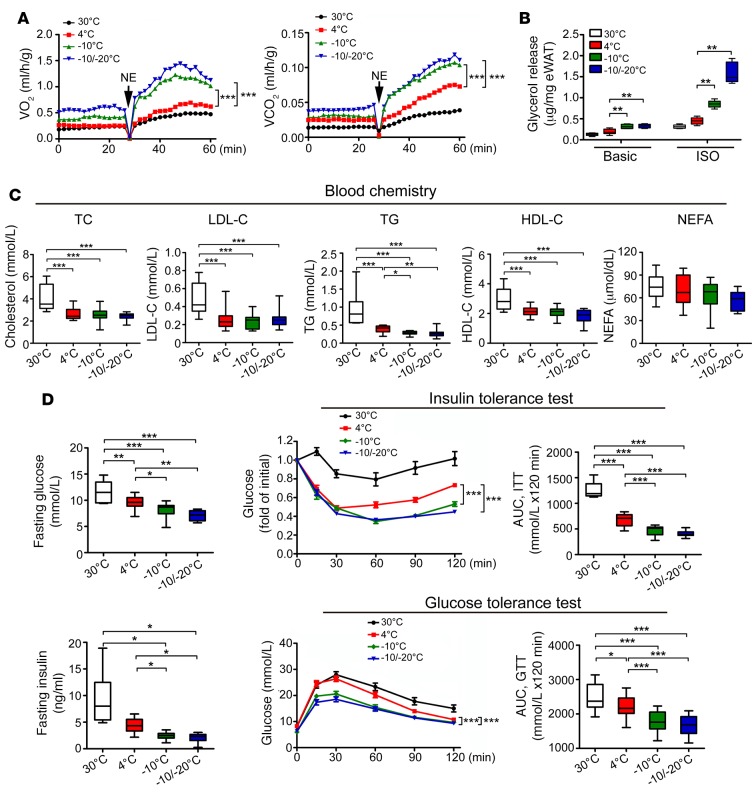
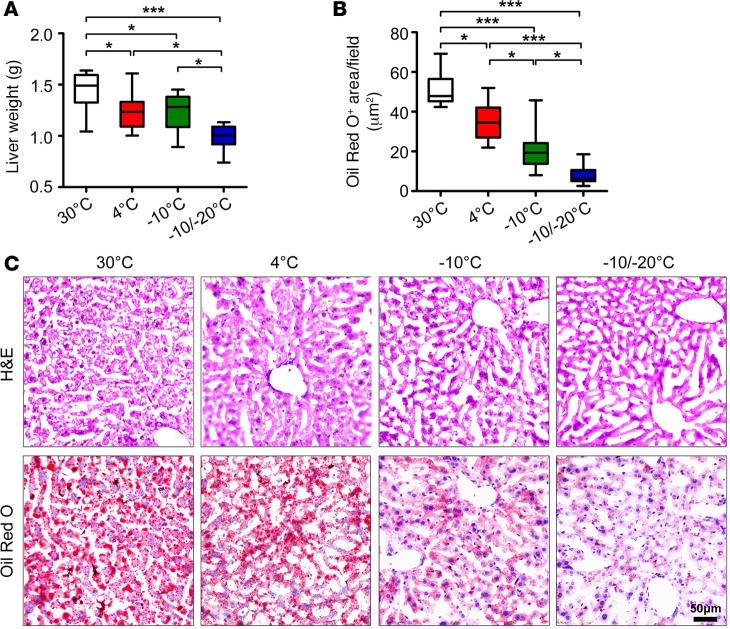
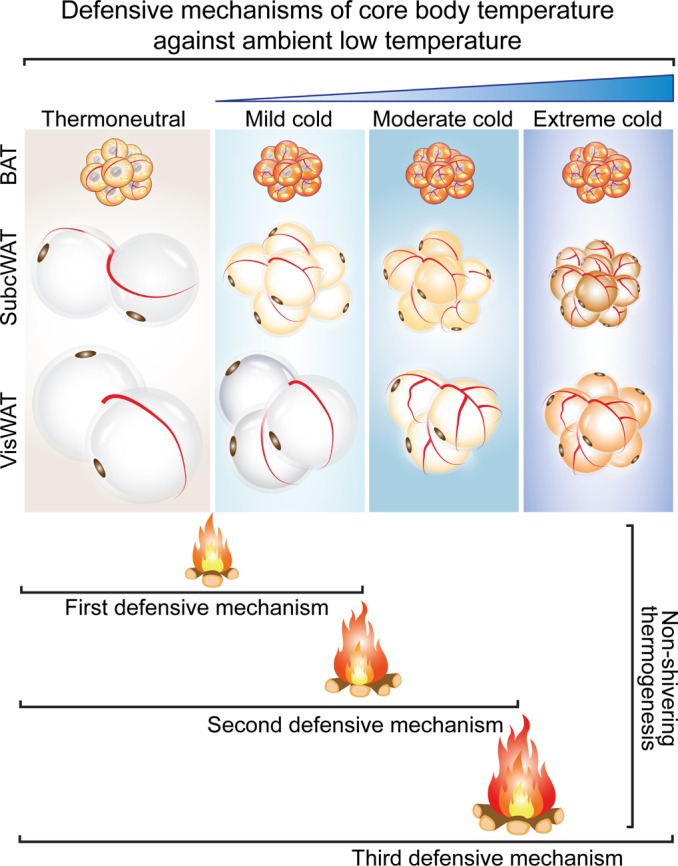
Visceral fat is considered the genuine and harmful white adipose tissue (WAT) that is associated to development of metabolic disorders, cardiovascular disease, and cancer. Here, we present a new concept to turn the harmful visceral fat into a beneficial energy consumption depot, which is beneficial for improvement of metabolic dysfunctions in obese mice. We show that low temperature-dependent browning of visceral fat caused decreased adipose weight, total body weight, and body mass index, despite increased food intake. In high-fat diet-fed mice, low temperature exposure improved browning of visceral fat, global metabolism via nonshivering thermogenesis, insulin sensitivity, and hepatic steatosis. Genome-wide expression profiling showed upregulation of WAT browning-related genes including Cidea and Dio2. Conversely, Prdm16 was unchanged in healthy mice or was downregulated in obese mice. Surgical removal of visceral fat and genetic knockdown of UCP1 in epididymal fat largely ablated low temperature-increased global thermogenesis and resulted in the death of most mice. Thus, browning of visceral fat may be a compensatory heating mechanism that could provide a novel therapeutic strategy for treating visceral fat-associated obesity and diabetes.


Conflict of interest statement

Conflict of interest: The authors have declared that no conflict of interest exists.

Figures

Figure 1
Figure 1. Food intake, body weight, BMI, browning of visceral WAT.
(A) Food intake per week, body weight, and BMI with exposure to various temperatures (n = 20 mice per group, data represent mean ± SEM, one-way ANOVA). (B) Mouse morphology and epididymal WAT (eWAT) morphology. (C) Fat mass of eWAT, s.c. WAT, and interscapular brown adipose tissue (iBAT) (n = 15 mice per group, data represent mean ± SEM, one-way ANOVA). (D) Contingent survival and death of mice exposed to various temperatures (n = 20 mice per group). (E) H&E, UCP1, prohibitin, perilipin A, and endomucin staining of eWAT. Scale bar: 20 μm. (F) Quantification of adipocyte (AC) size and UCP1-, prohibitin-, and endomucin-positive signals of eWAT (50 random fields from 10 mice in each group). **P < 0.01; **P < 0.01; ***P < 0.001, one-way ANOVA. Box-and-whisker plots show median (line within box), upper and lower quartile (bounds of box), and minimum and maximum values (bars).
Figure 2
Figure 2. Genome-wide profiling, qPCR, and Western blot analyses of eWAT.
(AD) Genome-wide profiling of eWAT with exposure to various temperatures by heat map and volcano analyses (n = 3 samples per group). (E) Left panel: qPCR analysis of Ucp1 expression in eWAT with exposure to various temperatures (n = 6 samples per group). Right panel: qPCR and Western blot analyses of UCP1 protein expression in eWAT (n = 6 samples per group). (F) Quantification of Leptin, Adiponectin, and Resistin mRNA levels in s.c. WAT exposed to various temperatures (n = 6 samples per group). *P < 0.05; **P < 0.01; ***P < 0.001, one-way ANOVA. Box-and-whisker plots show median (line within box), upper and lower quartile (bounds of box), and minimum and maximum values (bars).
Figure 3
Figure 3. Food intake, body weight, BMI, and browning of visceral WAT of HFD-fed obese mice.
(A) Food intake per week, body weight, and BMI of various temperature-exposed HFD-fed obese mice (n = 15 mice per group, data represent mean ± SEM, one-way ANOVA). (B) Mouse morphology and eWAT morphology. (C) Fat mass of eWAT, s.c. WAT, and iBAT of various HFD-fed obese mice (n = 15 mice per group, data represent mean ± SEM, one-way ANOVA). (D) Contingent survival and death of mice exposed to various temperatures (n = 20 mice per group). (E and F) H&E, UCP1, prohibitin, perilipin A, and endomucin staining of eWAT. Scale bars: 20 μm. (G) Quantification of AC size and UCP1-, prohibitin-, and endomucin-positive signals of eWAT (40 random fields from 8 mice in each group). *P < 0.05; **P < 0.01; ***P < 0.001, one-way ANOVA. Box-and-whisker plots show median (line within box), upper and lower quartile (bounds of box), and minimum and maximum values (bars).
Figure 4
Figure 4. Micro-PET imaging, nonshivering thermogenesis, lipolysis, blood lipid profiling, and glucose metabolism.
(A) Micro-PET imaging of iBAT, s.c. WAT, and eWAT. (B) Metabolic rates of O2 consumption and CO2 production in response to norepinephrine (NE) (n = 5 mice per group, two-way ANOVA, data represent mean ± SEM). (C) Glycerol release from eWAT of various groups (n = 6 samples per group). One-way ANOVA. (D) Blood lipid profile of cholesterol, low-density lipoprotein cholesterol (LDL-C), triglycerides (TG), high-density lipoprotein cholesterol (HDL-C), and nonesterified fatty acids (NEFAs) (n = 15 samples per group). One-way ANOVA. (E) Fasting glucose, fasting insulin, insulin-tolerance test, and glucose-tolerance test with exposure to various temperatures (n = 8–10 animals per group). AUC of insulin-tolerance test and glucose-tolerance test. One-way ANOVA. (F) Contingency survival and death of eWAT-less (eWL) and sham-operated (Sham) mice exposed to –10°C/–20°C (n = 20 animals per group, χ2 test). (G) Metabolic rates of O2 consumption and CO2 production of eWL and sham-operated mice in response to norepinephrine (NE) under –10°C/–20°C (n = 5 animals per group). Two-way ANOVA, data represent mean ± SEM. (H) Fasting glucose, fasting insulin, and insulin-tolerance test of eWL and sham-operated mice exposed to –10°C/–20°C (n = 6 animals per group). AUC of insulin-tolerance test. *P < 0.05; **P < 0.01; ***P < 0.001, 2-tailed t test for fasting glucose, fasting insulin, and AUC; two-way ANOVA for insulin-tolerance test. Data represent mean ± SEM. Box-and-whisker plots show median (line within box), upper and lower quartile (bounds of box), and minimum and maximum values (bars).
Figure 5
Figure 5. Impacts of UCP1 knockdown on global metabolic functions under an extreme cold condition.
(A) Immunohistological analysis of AAV transduction efficiency. AAV-Gfp– and AAV-shUcp1–transduced eWAT expressed GFP (green). The sections were counter-stained with DAPI (blue). Transduction efficiencies were quantified (n = 4 samples per group, 2-tailed t test). (B) Knockdown efficiency of endogenous UCP1 protein was analyzed by Western blot analysis (n = 6 samples per group, 2-tailed t test). (C) Contingent survival and death of AAV-Gfp– and AAV-shUcp1–transduced mice under –10°C/–20°C (n = 20 mice per group, χ2 test). (D) Metabolic rates of O2 consumption and CO2 production of AAV-Gfp– and AAV-shUcp1–transduced mice in response to norepinephrine (NE) under –10°C/–20°C (n = 5 mice per group). Two-way ANOVA, data represent mean ± SEM. (E) Fasting glucose, fasting insulin, and insulin-tolerance test of AAV-Gfp– and AAV-shUcp1–transduced mice under –10°C/–20°C (n = 10 mice per group). AUC of insulin-tolerance test. *P < 0.05; **P < 0.01; ***P < 0.001. 2-tailed t test for fasting glucose, fasting insulin, and AUC; two-way ANOVA for insulin-tolerance test. Data represent mean ± SEM. Box-and-whisker plots show median (line within box), upper and lower quartile (bounds of box), and minimum and maximum values (bars).
Figure 6
Figure 6. Nonshivering thermogenesis, lipolysis, blood lipid profiling, and glucose metabolism in HFD-fed obese mice.
(A) Metabolic rates of O2 consumption and CO2 production of HFD-induced obese mice in response to NE (n = 5 mice per group). Two-way ANOVA. Data represent mean ± SEM. (B) Glycerol release from eWAT of various HFD-induced obese mice (n = 6 samples per group). One-way ANOVA. (C) Blood lipid profile of cholestero (TC), LDL-C, TG, HDL-C, and NEFAs of HFD-induced obese animals (n = 15 samples per group). One-way ANOVA. (D) Fasting glucose, fasting insulin, insulin-tolerance test, and glucose-tolerance test of HFD-induced obese mice exposed to various temperatures (n = 8 samples per group for 30°C; n = 11–15 samples per group for other groups). AUC of insulin-tolerance test and glucose-tolerance test. *P < 0.05; **P < 0.01; ***P < 0.001. One-way ANOVA for fasting glucose, fasting insulin, and AUC; two-way ANOVA for insulin-tolerance test and glucose-tolerance test. Data represent mean ± SEM. Box-and-whisker plots show median (line within box), upper and lower quartile (bounds of box), and minimum and maximum values (bars).
Figure 7
Figure 7. Liver steatosis in HFD-fed obese mice.
(AC) Weight, H&E staining, and Oil Red O staining of liver tissues from HFD-induced obese mice exposed to various temperatures (n = 8 animals per group). Scale bar: 50 μm. Oil Red O–positive signals were quantified from 20 random fields. *P < 0.05; ***P < 0.001. One-way ANOVA.
Figure 8
Figure 8. Schematic diagram of successive activation of defensive mechanisms against decreasing environmental cold.
Under mild cold such as 4°C exposure, activation of the BAT-nonshivering thermogenesis and modest browning of s.c. WAT are sufficient to maintain core body temperature. However, visceral WAT remains thermogenically inactive. Further decreased environmental temperature — to –10°C, for example — enhances browning of s.c. WAT and triggers modest browning of visceral fat to generate nonshivering heat. With extreme cold such as –10°C/–20°C, browning of visceral fat markedly contributes to nonshivering thermogenesis to main core body temperature. Additionally, browning of visceral fat increases insulin sensitivity and improves liver steatosis in obese mice.

References

    1. Kopelman PG. Obesity as a medical problem. Nature. 2000;404(6778):635–643. - PubMed
    1. Yanovski SZ, Yanovski JA. Obesity. N Engl J Med. 2002;346(8):591–602. doi: 10.1056/NEJMra012586. - DOI - PubMed
    1. Zimmet P, Alberti KG, Shaw J. Global and societal implications of the diabetes epidemic. Nature. 2001;414(6865):782–787. doi: 10.1038/414782a. - DOI - PubMed
    1. Flier JS. Obesity wars: molecular progress confronts an expanding epidemic. Cell. 2004;116(2):337–350. doi: 10.1016/S0092-8674(03)01081-X. - DOI - PubMed
    1. Spiegelman BM, Flier JS. Adipogenesis and obesity: rounding out the big picture. Cell. 1996;87(3):377–389. doi: 10.1016/S0092-8674(00)81359-8. - DOI - PubMed

Publication types

MeSH terms