. 2017 Feb 23;2(4):e90508.
doi: 10.1172/jci.insight.90508.

The human brain produces fructose from glucose

Affiliations

The human brain produces fructose from glucose

Janice J Hwang et al. JCI Insight. .

Abstract

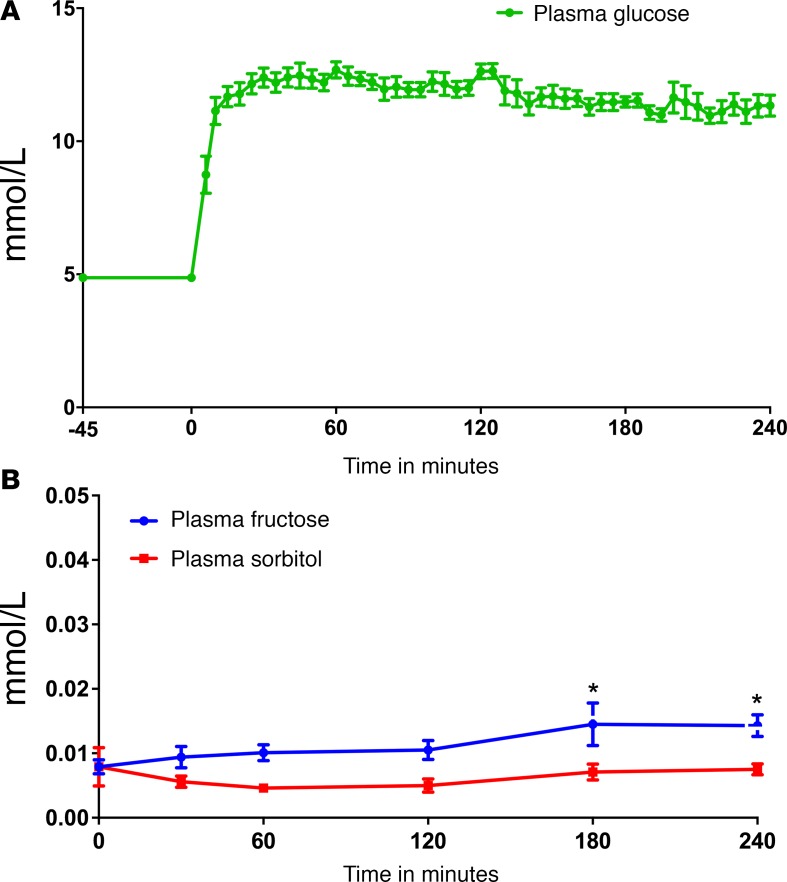
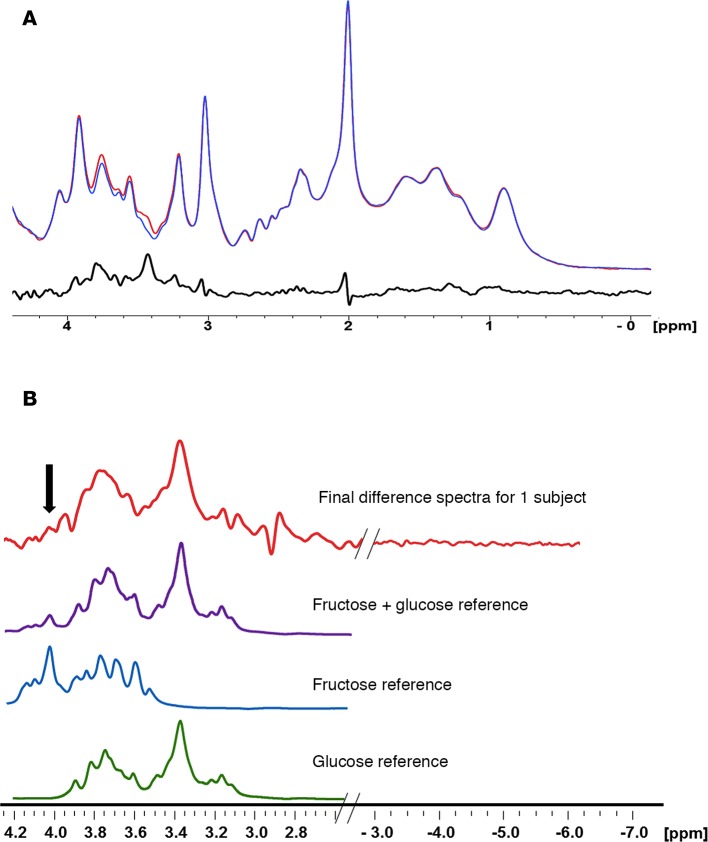
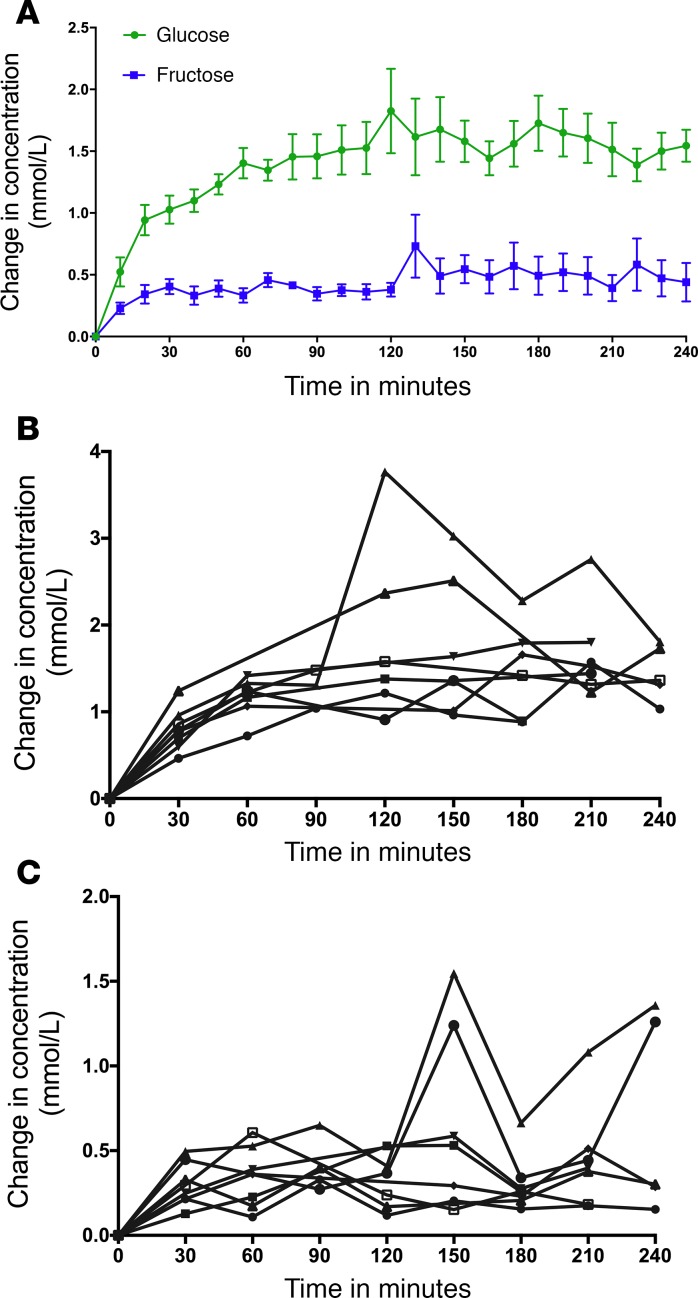
Fructose has been implicated in the pathogenesis of obesity and type 2 diabetes. In contrast to glucose, CNS delivery of fructose in rodents promotes feeding behavior. However, because circulating plasma fructose levels are exceedingly low, it remains unclear to what extent fructose crosses the blood-brain barrier to exert CNS effects. To determine whether fructose can be endogenously generated from glucose via the polyol pathway (glucose → sorbitol → fructose) in human brain, 8 healthy subjects (4 women/4 men; age, 28.8 ± 6.2 years; BMI, 23.4 ± 2.6; HbA1C, 4.9% ± 0.2%) underwent 1H magnetic resonance spectroscopy scanning to measure intracerebral glucose and fructose levels during a 4-hour hyperglycemic clamp (plasma glucose, 220 mg/dl). Using mixed-effects regression model analysis, intracerebral glucose rose significantly over time and differed from baseline at 20 to 230 minutes. Intracerebral fructose levels also rose over time, differing from baseline at 30 to 230 minutes. The changes in intracerebral fructose were related to changes in intracerebral glucose but not to plasma fructose levels. Our findings suggest that the polyol pathway contributes to endogenous CNS production of fructose and that the effects of fructose in the CNS may extend beyond its direct dietary consumption.


Conflict of interest statement

Conflict of interest: The authors have declared that no conflict of interest exists.

Figures

Figure 1
Figure 1. (A) Plasma glucose levels over time.
(B) Plasma fructose and sorbitol levels over time.*P < 0.0001 at times 180 and 240 minutes compared with baseline for fructose. Data represent mean ± SEM.
Figure 2
Figure 2. Intracerebral fructose and glucose levels.
(A) Difference spectrum procedure showing for data from 1 subject. Blue spectra were obtained at baseline; red spectra were obtained at 10 minutes; black spectra is the difference between the red and blue spectra. (B) In vivo difference spectrum (final difference spectra) from 1 subject compared with reference spectra for fructose plus glucose, pure fructose, and pure glucose obtained under in vivo conditions of temperature 37°C, pH 7.4, and ionic strength of 150 mM. The fructose and glucose solution spectra were added, with their relative intensities adjusted to match their relative concentrations measured in vivo. The spectral regions plotted from the subject have been extended to include the region from –3 to –7 ppm where only noise is present in order to show the signal-to-noise ratio of the fructose peak. The arrow denotes the unique fructose peak at 4.0–4.1 ppm used to distinguish fructose from glucose.
Figure 3
Figure 3. Time course of the changes in glucose and fructose concentration during the glucose infusion.
(A) Change in intracerebral glucose was different compared with baseline beginning at 10 minutes (P < 0.001). The change in fructose was different compared with baseline beginning at 20 minutes (P < 0.01 from time 20 minutes to 120 minutes, P < 0.0001 from time 130 minutes to 220 minutes). Data expressed as mean ± SEM. (B) Change in intracerebral glucose plotted for each individual subject. (C) Change in intracerebral fructose plotted for each individual subject. The vertical scale is multiplied by 2× relative to the individual glucose difference plot.

References

    1. Stanhope KL, Schwarz JM, Havel PJ. Adverse metabolic effects of dietary fructose: results from the recent epidemiological, clinical, and mechanistic studies. Curr Opin Lipidol. 2013;24(3):198–206. doi: 10.1097/MOL.0b013e3283613bca. - DOI - PMC - PubMed
    1. Cha SH, Wolfgang M, Tokutake Y, Chohnan S, Lane MD. Differential effects of central fructose and glucose on hypothalamic malonyl-CoA and food intake. Proc Natl Acad Sci USA. 2008;105(44):16871–16875. doi: 10.1073/pnas.0809255105. - DOI - PMC - PubMed
    1. Page KA, et al. Effects of fructose vs glucose on regional cerebral blood flow in brain regions involved with appetite and reward pathways. JAMA. 2013;309(1):63–70. doi: 10.1001/jama.2012.116975. - DOI - PMC - PubMed
    1. Luo S, Monterosso JR, Sarpelleh K, Page KA. Differential effects of fructose versus glucose on brain and appetitive responses to food cues and decisions for food rewards. Proc Natl Acad Sci USA. 2015;112(20):6509–6514. doi: 10.1073/pnas.1503358112. - DOI - PMC - PubMed
    1. Gruetter R, et al. Direct measurement of brain glucose concentrations in humans by 13C NMR spectroscopy. Proc Natl Acad Sci USA. 1992;89(3):1109–1112. doi: 10.1073/pnas.89.3.1109. - DOI - PMC - PubMed

Publication types