. 2017 Feb 23;2(4):e90626.
doi: 10.1172/jci.insight.90626.

Flow virometric sorting and analysis of HIV quasispecies from plasma

Affiliations

Flow virometric sorting and analysis of HIV quasispecies from plasma

Thomas Musich et al. JCI Insight. .

Abstract

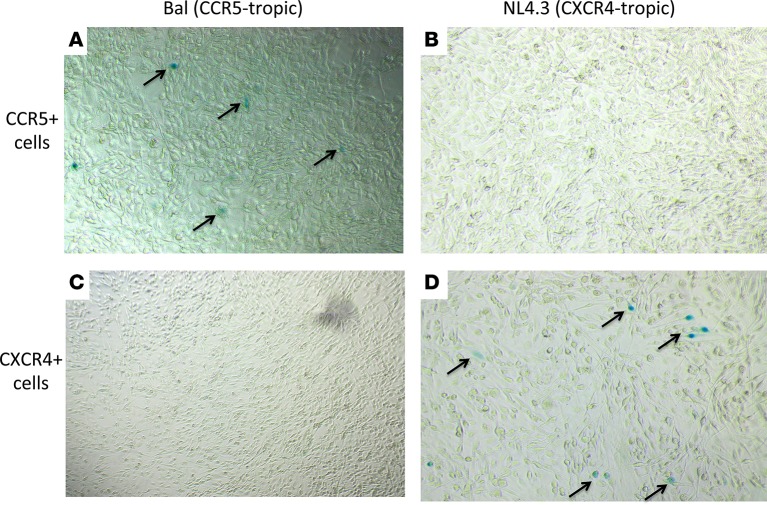
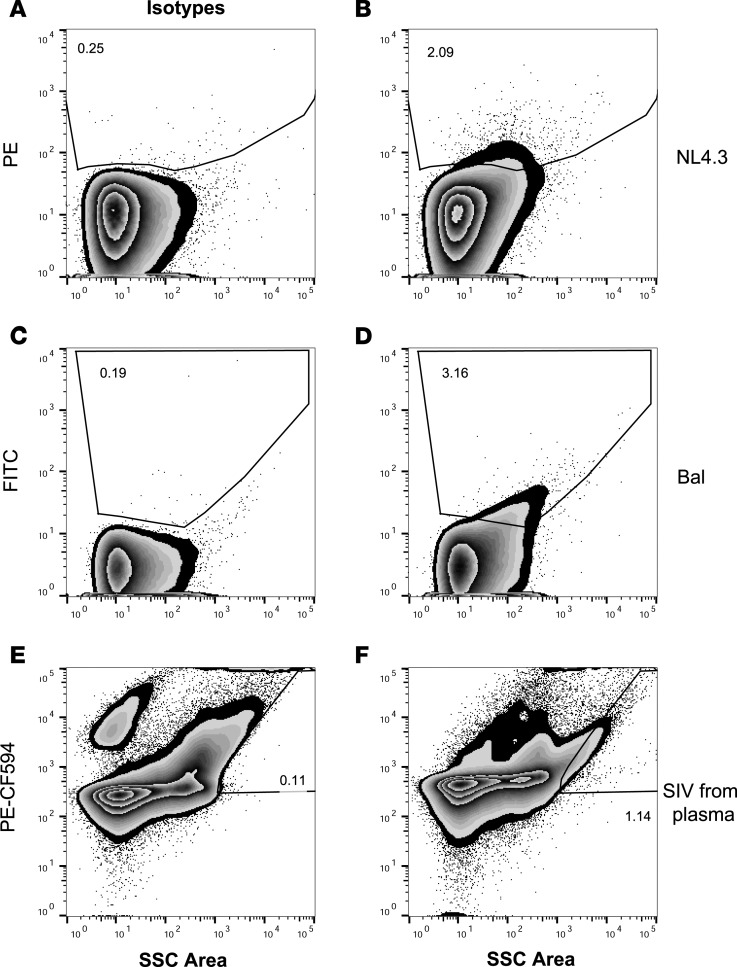
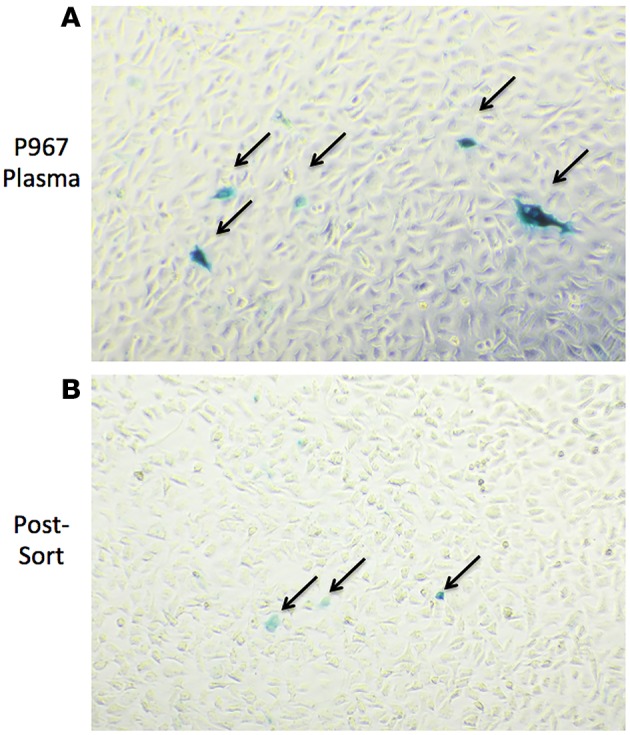
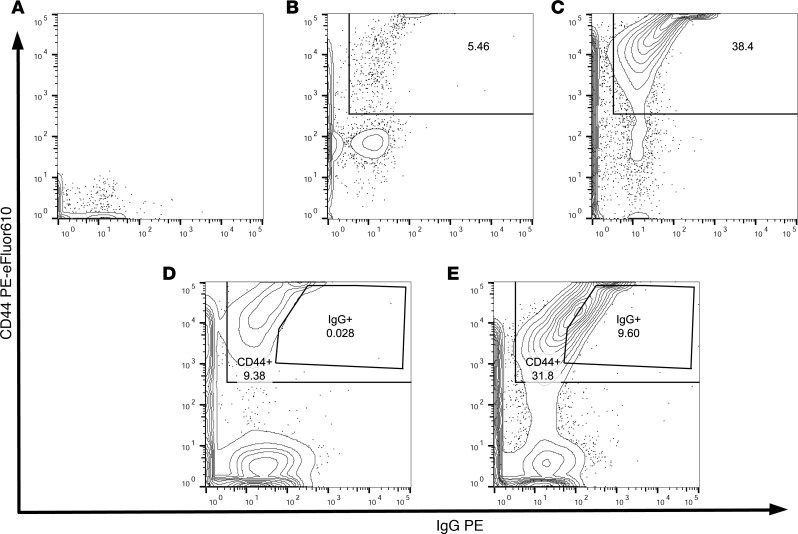
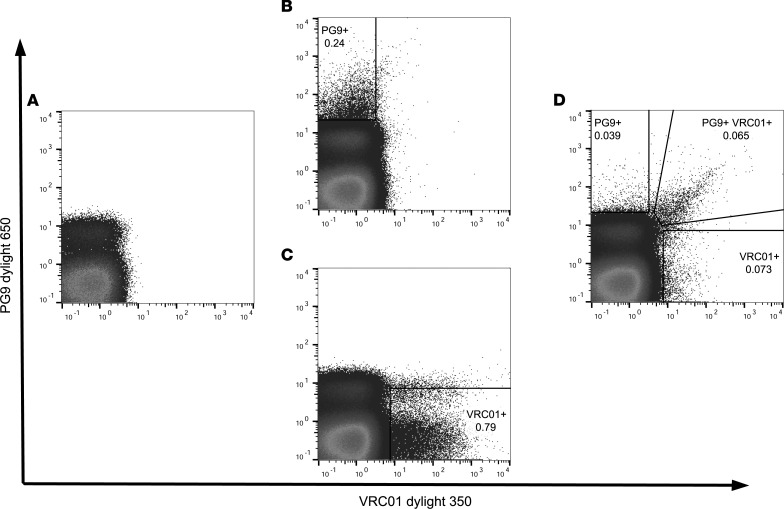
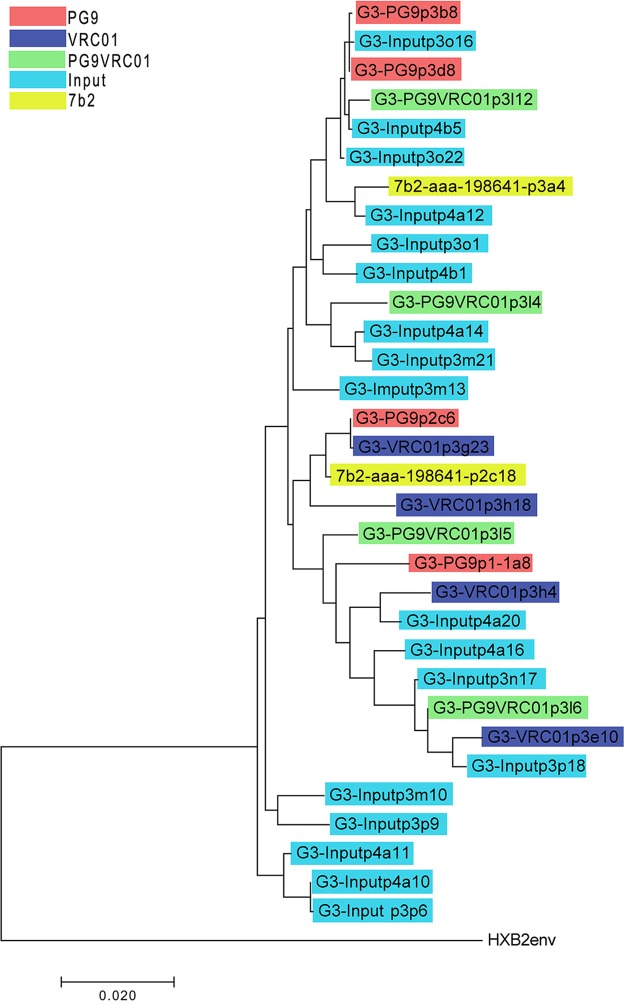
Flow cytometry is utilized extensively for cellular analysis, but technical limitations have prevented its routine application for characterizing virus. The recent introduction of nanoscale fluorescence-activated cytometric cell sorting now allows analysis of individual virions. Here, we demonstrate staining and sorting of infectious HIV. Fluorescent antibodies specific for cellular molecules found on budding virions were used to label CCR5-tropic Bal HIV and CXCR4-tropic NL4.3 HIV Env-expressing pseudovirions made in THP-1 cells (monocyte/macrophage) and H9 cells (T cells), respectively. Using a flow cytometer, we resolved the stained virus beyond isotype staining and demonstrated purity and infectivity of sorted virus populations on cells with the appropriate coreceptors. We subsequently sorted infectious simian/human immunodeficiency virus from archived plasma. Recovery was approximately 0.5%, but virus present in plasma was already bound to viral-specific IgG generated in vivo, likely contributing to the low yield. Importantly, using two broadly neutralizing HIV antibodies, PG9 and VRC01, we also sorted virus from archived human plasma and analyzed the sorted populations genetically and by proteomics, identifying the quasispecies present. The ability to sort infectious HIV from clinically relevant samples provides material for detailed molecular, genetic, and proteomic analyses applicable to future design of vaccine antigens and potential development of personalized treatment regimens.


Conflict of interest statement

Conflict of interest: The authors have declared that no conflict of interest exists.

Figures

Figure 1
Figure 1. Sorting HIV derived from different cell types.
Bal HIV-1 was made in THP-1 cells, and NL4.3 was made in H9 cells. (A) Unstained Bal. (B) Bal stained with anti-CD36. (C) Unstained NL4.3. (D) NL4.3 stained with anti-CD26. (E) Bal and NL4.3 were first stained separately with anti-CD36 and anti-CD26, respectively, and then combined and sorted. (F) Bal and NL4.3 were first combined and then stained at the same time with both anti-CD36 and anti-CD26. (G) Sorted CD36+ population from E reanalyzed after sort. (H) Sorted CD26+ population from E reanalyzed after sort. (I) Sorted CD36+ population from F reanalyzed after sort. (J) Sorted CD26+ population from F reanalyzed after sort. This figure represents 1 of 3 separate experiments.
Figure 2
Figure 2. Sorted HIV-1 originating from different cell types maintains tropism and infectivity.
Bal HIV-1 was made in THP-1 cells, and NL4.3 was made in H9 cells. These viral populations were mixed, stained together for CD36 and CD26, sorted from one another, and used to infect U373-MAGI-CCR5E cells (A and B) and U373-MAGI-CXCR4CEM cells (C and D). After 48 hours, cells were fixed and stained for β-galactosidase expression. Sorted Bal only infected CCR5+ cells (A), and sorted NL4.3 only infected CXCR4+ cells (D). Infected cells are tinted blue and marked with arrows. Original magnification, ×10.
Figure 3
Figure 3. Isotype staining of cell line–derived HIV-1 and SHIV from plasma.
(A and B) NL4.3 HIV-1 derived from H9 cells stained with (A) isotype control and (B) anti-CD26. (C and D) Bal HIV-1 derived from THP-1 cells stained with (C) isotype and (D) anti-CD36. (E and F) High viral load plasma (>106 RNA copies/ml) from SHIV-infected rhesus macaque P967 stained with (E) isotype and (F) anti-CD44. This CD44+ stained SHIV was then sorted from the infectious plasma. This figure represents 1 of 3 separate experiments.
Figure 4
Figure 4. SHIV sorted from plasma is infectious.
TZM-BL cells were used to titer virus in plasma from infected animal P967 before and after sort. 48 hours after the cells were inoculated, they were stained for the expression of β-galactosidase. Infected cells are tinted blue and marked with arrows. (A) The image illustrates that the infected plasma contained infectious virus. (B) The image demonstrates that virus sorted from the plasma (CD44+ virus) using the methods described herein maintains infectivity. The titers are quantified in Table 1. Original magnification, ×10.
Figure 5
Figure 5. SHIV sorted from infectious plasma is bound to IgG generated by the infected animal.
(A) Unstained serum has no autofluorescence. (B) Infected serum stained with anti-CD44 sorted for CD44+ virus. (C) Reanalyzed sorted CD44+ virus. (D) CD44+ virus sorted from serum stained with isotype control and (E) anti-rhesus IgG. This figure represents 1 of 3 separate experiments.
Figure 6
Figure 6. HIV-1 virus sorted from infected human plasma using two broadly neutralizing antibodies.
(A) Unstained plasma has no autofluorescence. (B) Infected plasma stained with PG9. (C) Infected plasma stained with VRC01. (D) Infected plasma stained simultaneously with PG9 and VRC01. The 3 populations shown were subsequently sorted and analyzed. This figure represents 1 of 5 separate experiments.
Figure 7
Figure 7. Phylogenetic tree of sorted HIV-1 from infectious patient plasma.
Molecular phylogenetic analysis by the maximum likelihood method was conducted on aligned input plasma and sorted PG9+, VRC01+, PG9+VRC01+, and 7B2-AAA+ populations. The evolutionary history was inferred by using the maximum likelihood method based on the Tamura-Nei model (33). The tree with the highest log likelihood (–8,368.3579) is shown. Initial tree(s) for the heuristic search were obtained automatically by applying the neighbor joining and BioNJ algorithms to a matrix of pairwise distances estimated using the maximum composite likelihood approach and then selecting the topology with superior log likelihood value. The tree is drawn to scale, with branch lengths measured in the number of substitutions per site. The analysis involved 33 nucleotide sequences. All positions containing gaps and missing data were eliminated. There were a total of 2,492 positions in the final data set. Evolutionary analyses were conducted in MEGA71 (34).

Similar articles

Cited by

References

    1. Hercher M, Mueller W, Shapiro HM. Detection and discrimination of individual viruses by flow cytometry. J Histochem Cytochem. 1979;27(1):350–352. doi: 10.1177/27.1.374599. - DOI - PubMed
    1. Brussaard CP, Marie D, Bratbak G. Flow cytometric detection of viruses. J Virol Methods. 2000;85(1-2):175–182. doi: 10.1016/S0166-0934(99)00167-6. - DOI - PubMed
    1. Loret S, El Bilali N, Lippé R. Analysis of herpes simplex virus type I nuclear particles by flow cytometry. Cytometry A. 2012;81(11):950–959. - PubMed
    1. Steen HB. Flow cytometer for measurement of the light scattering of viral and other submicroscopic particles. Cytometry A. 2004;57(2):94–99. - PubMed
    1. van der Pol E, van Gemert MJ, Sturk A, Nieuwland R, van Leeuwen TG. Single vs. swarm detection of microparticles and exosomes by flow cytometry. J Thromb Haemost. 2012;10(5):919–930. doi: 10.1111/j.1538-7836.2012.04683.x. - DOI - PubMed

Publication types