. 2017 Feb 23;2(4):e91230.
doi: 10.1172/jci.insight.91230.

Loss of immune homeostasis dictates SHIV rebound after stem-cell transplantation

Affiliations

Loss of immune homeostasis dictates SHIV rebound after stem-cell transplantation

Christopher W Peterson et al. JCI Insight. .

Abstract

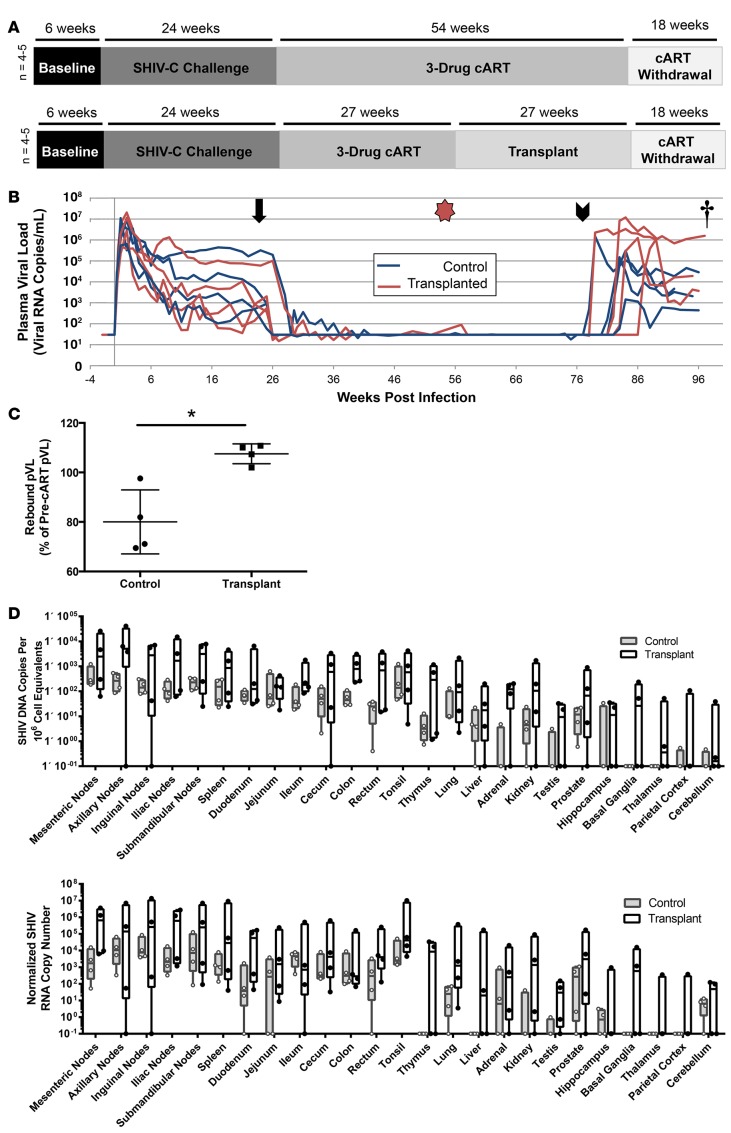
The conditioning regimen used as part of the Berlin patient's hematopoietic cell transplant likely contributed to his eradication of HIV infection. We studied the impact of conditioning in simian-human immunodeficiency virus-infected (SHIV-infected) macaques suppressed by combination antiretroviral therapy (cART). The conditioning regimen resulted in a dramatic, but incomplete depletion of CD4+ and CD8+ T cells and CD20+ B cells, increased T cell activation and exhaustion, and a significant loss of SHIV-specific Abs. The disrupted T cell homeostasis and markers of microbial translocation positively correlated with an increased viral rebound after cART interruption. Quantitative viral outgrowth and Tat/rev-induced limiting dilution assays showed that the size of the latent SHIV reservoir did not correlate with viral rebound. These findings identify perturbations of the immune system as a mechanism for the failure of autologous transplantation to eradicate HIV. Thus, transplantation strategies may be improved by incorporating immune modulators to prevent disrupted homeostasis, and gene therapy to protect transplanted cells.


Conflict of interest statement

Conflict of interest: The authors have declared that no conflict of interest exists.

Figures

Figure 1
Figure 1. SHIV rebound is increased in transplanted animals following cART withdrawal.
(A) Two groups of 5 animals were analyzed in this study. Prior to infection, baseline measurements were collected over 6 weeks. Following intravenous virus challenge with simian-human immunodeficiency virus 1157ipd3N4 (SHIV-C), infection progressed for 6 months prior to initiation of combination antiretroviral therapy (cART). Untransplanted animals (upper panel) remained on cART for approximately 1 year, followed by cART withdrawal and necropsy 15–20 weeks later. Transplanted animals (lower panel) were treated identically, except for hematopoietic stem cell transplantation conducted 6 months following initiation of cART, using autologous CD34+ cells cryopreserved prior to infection. One untransplanted and 1 transplanted animal were excluded partway through the study due to unrelated health issues; data were included where applicable. (B) At the indicated times following SHIV infection, plasma viral load (pVL) was measured by quantitative PCR (QPCR) from transplanted animals (red lines) or untransplanted animals (blue lines). Arrow, cART initiation; star, autologous transplant; arrowhead, cART withdrawal; dagger, necropsy. (C) Ratio of viremia following post-cART viral rebound to comparable time points during primary infection (see Methods). Data are the mean ± SD. (D) The indicated tissues were collected at necropsy from untransplanted (gray bars) and transplanted animals (white bars). Total genomic DNA and RNA were extracted for viral nucleic acid measurements by QPCR. Total SHIV DNA (upper panel) was normalized to a genomic DNA standard (macaque RNaseP p30, MRPP30). SHIV genomic RNA (lower panel) was normalized to the crossing threshold value of MRPP30. Boxes represent median and 25th/75th percentiles, and whiskers represent minimum/maximum values for 4 animals in each cohort. *P < 0.05 by 2-tailed Mann-Whitney test.
Figure 2
Figure 2. Peripheral T cell subsets and CD20+ B cells are significantly depleted following autologous transplantation.
Absolute numbers of peripheral blood CD3+CD4+ T cells (A), CD3+CD8+ T cells (B), and CD20+ B cells (C) were quantified by complete blood cell (CBC) counts and flow cytometry from transplanted animals (red lines) and untransplanted animals (blue lines), and plotted as a function of weeks after infection with simian-human immunodeficiency virus 1157ipd3N4 (SHIV-C). Batched flow analyses and CBC data were used to calculate absolute numbers of CD4+ naive (D), CD4+ central memory (CM, E), CD4+ effector memory (EM, F), CD8+ naive (G), CD8+ CM (H), and CD8+ EM subsets (I). Star, autologous transplant; dagger, necropsy. Values in D through I represent mean ± SD. *P < 0.05, **P < 0.01 by 2-tailed Mann-Whitney test. Time points along the x axes in D through I are defined in Supplemental Table 1.
Figure 3
Figure 3. SHIV-specific B-cell function is significantly impaired following autologous transplantation.
Serum titers of antibodies specific for the SIV (A) or HIV (B) portions of simian-human immunodeficiency virus 1157ipd3N4 (SHIV-C) were measured by ELISA. Star, autologous transplant; dagger, necropsy. AUC was calculated from pre-transplant to combination antiretroviral therapy (cART) withdrawal (pre-ART WD) and from cART withdrawal to necropsy (post-ART WD) for anti-SIV (C) and anti-HIV (D) antibody titers. Values in C and D represent mean ± SD. *P < 0.05 by 2-tailed Mann-Whitney test. Near-significant P values are also indicated.
Figure 4
Figure 4. Significant increase in CD4+Ki67+ and CD8+Ki67+ subset proportions following autologous transplantation.
At the indicated time points, flow cytometry was used to analyze batched peripheral blood mononuclear cell (PBMC) samples for expression of the proliferation marker Ki67 in CD4+ (AC) and CD8+ T cells (DF). Naive, central memory (CM), and effector memory (EM) subsets are shown. Values represent mean ± SD. *P < 0.05, **P < 0.01 by 2-tailed Mann-Whitney test. Near-significant P values are also indicated. Time points along the x axes are defined in Supplemental Table 1.
Figure 5
Figure 5. Significant increase in CD4+PD-1+ and CD8+PD-1+ subset proportions following autologous transplantation.
At the indicated time points, flow cytometry was used to analyze batched peripheral blood mononuclear cell (PBMC) samples for expression of the proliferation/exhaustion marker PD-1 in CD4+ (AC) and CD8+ T cells (DF). Naive, central memory (CM), and effector memory (EM) subsets are shown. Values represent mean ± SD. *P < 0.05 by 2-tailed Mann-Whitney test. Time points along the x axes are defined in Supplemental Table 1.
Figure 6
Figure 6. Significant increase in CD4+HLA-DR+ and CD8+HLA-DR+ subset proportions following autologous transplantation.
At the indicated time points, flow cytometry was used to analyze batched peripheral blood mononuclear cell (PBMC) samples for expression of the activation marker HLA-DR in CD4+ (AC) and CD8+ T cells (DF). Naive, central memory (CM), and effector memory (EM) subsets are shown. Values in D through I represent mean ± SD. *P < 0.05, **P < 0.01 by 2-tailed Mann-Whitney test. Time points along the x axes are defined in Supplemental Table 1.
Figure 7
Figure 7. Elevated levels of inflammatory cytokines, growth factors, and microbial translocation markers following autologous transplant.
Serum was collected at the indicated time points following autologous transplantation in transplanted (open squares) and matched control animals (closed circles). Shown are measurements of zonulin (A), C-reactive protein (CRP, B), soluble CD14 (sCD14) (C), lipopolysaccharide binding protein (LBP, D), soluble IL-8 (E), monocyte chemoattractant protein-1 (MCP-1, F), and TGF-α (G). Samples with undetectable levels of target protein(s) were omitted from analyses. The levels of CRP in 3 samples were too high to be measured in our assay, and were assigned a value of 150,000 ng/ml, equivalent to twice the highest standard. Horizontal lines represent mean values for each group. *P < 0.05, **P < 0.01 by 2-tailed Mann-Whitney test. Near-significant P values are also indicated. Time points along the x axes are defined in Supplemental Table 1.
Figure 8
Figure 8. Transplantation does not increase the size of the latent simian-human immunodeficiency virus reservoir.
At time points immediately prior to transplantation (Time Point 1, 6 months following initiation of combination antiretroviral therapy [cART]), and 4–5 months after transplantation (Time Point 2, 10–11 months following initiation of cART), apheresis was performed to collect large numbers of lymphocytes from transplanted and control animals. (A) Quantitative viral outgrowth assay (QVOA) from Time Points 1 and 2. Results are expressed as infectious units per million cells (IUPM). Samples that were undetectable by QVOA were plotted as 0.01 IUPM for graphing purposes. (B) Tat/rev-induced limiting dilution assay, measured from same cell samples as in A. Horizontal lines represent mean values for each group. msSHIV RNA, multispliced simian-human immunodeficiency virus RNA; NHP, nonhuman primate.

References

    1. Murray AJ, Kwon KJ, Farber DL, Siliciano RF. The latent reservoir for HIV-1: how immunologic memory and clonal expansion contribute to HIV-1 persistence. J Immunol. 2016;197(2):407–417. doi: 10.4049/jimmunol.1600343. - DOI - PMC - PubMed
    1. Deeks SG, et al. International AIDS Society global scientific strategy: towards an HIV cure 2016. Nat Med. 2016;22(8):839–850. doi: 10.1038/nm.4108. - DOI - PMC - PubMed
    1. Hütter G, et al. Long-term control of HIV by CCR5 Delta32/Delta32 stem-cell transplantation. N Engl J Med. 2009;360(7):692–698. doi: 10.1056/NEJMoa0802905. - DOI - PubMed
    1. Allers K, et al. Evidence for the cure of HIV infection by CCR5Δ32/Δ32 stem cell transplantation. Blood. 2011;117(10):2791–2799. doi: 10.1182/blood-2010-09-309591. - DOI - PubMed
    1. Petz LD, et al. Progress toward curing HIV infection with hematopoietic cell transplantation. Stem Cells Cloning. 2015;8:109–116. - PMC - PubMed

Publication types

MeSH terms

Substances