. 2017 May;10(5):711-722.
doi: 10.1002/aur.1755. Epub 2017 Feb 27.

In pursuit of neurophenotypes: The consequences of having autism and a big brain

Affiliations

In pursuit of neurophenotypes: The consequences of having autism and a big brain

David G Amaral et al. Autism Res. 2017 May.

Abstract

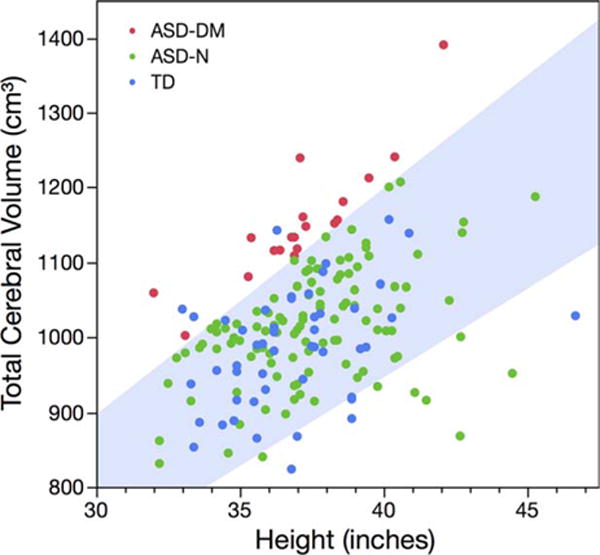
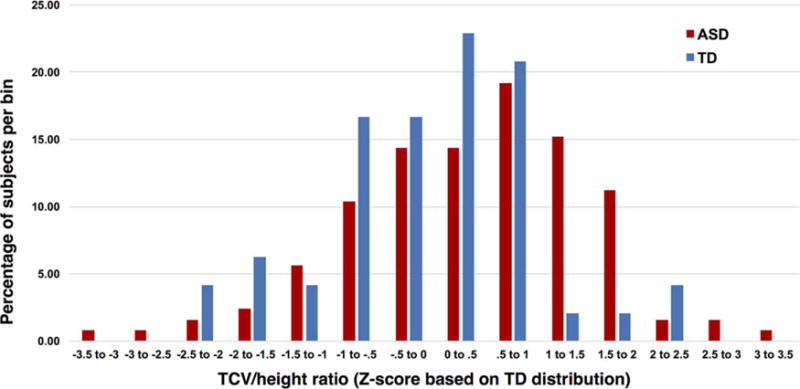
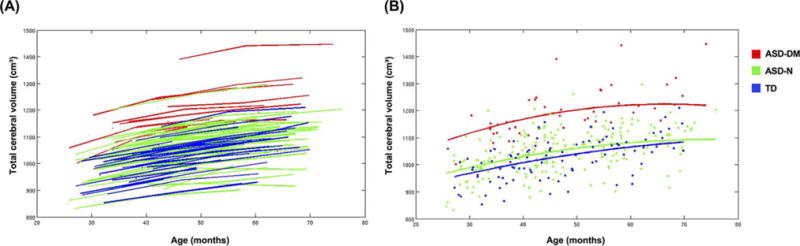
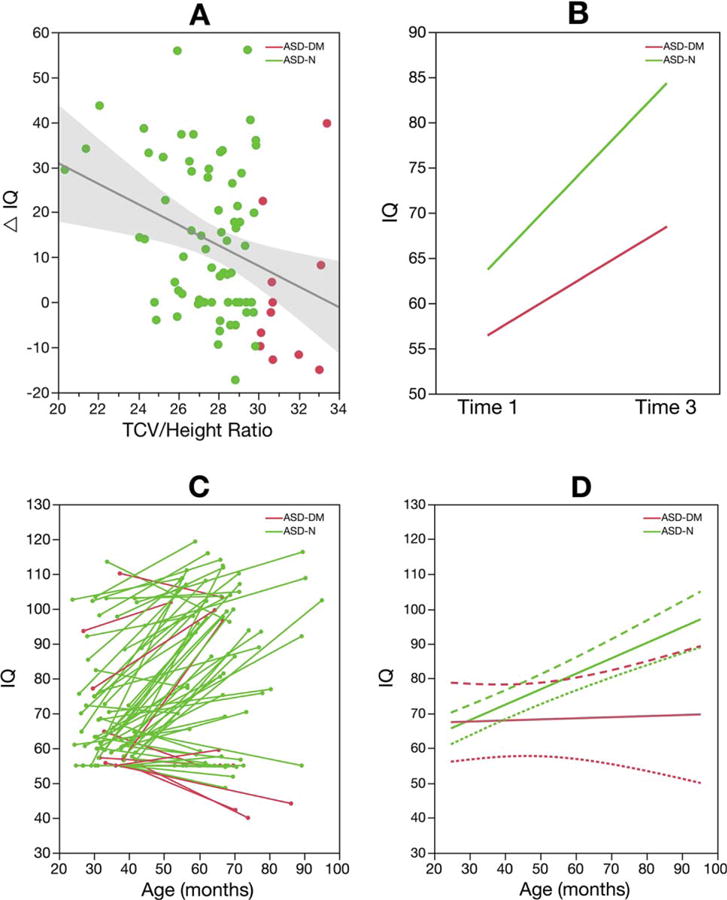
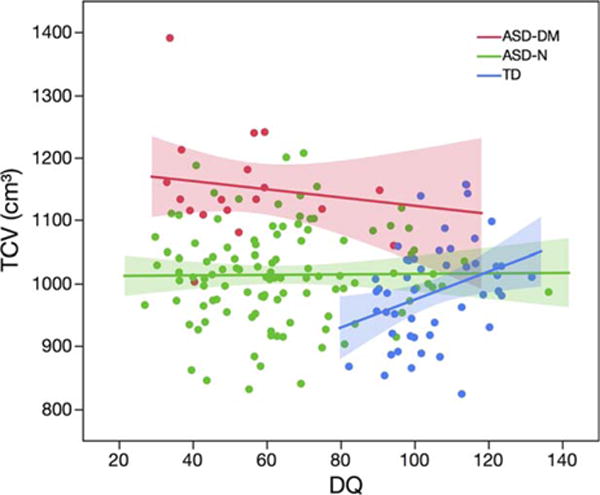
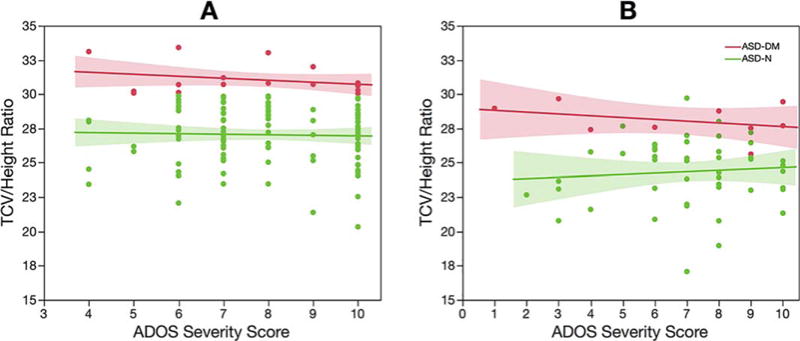
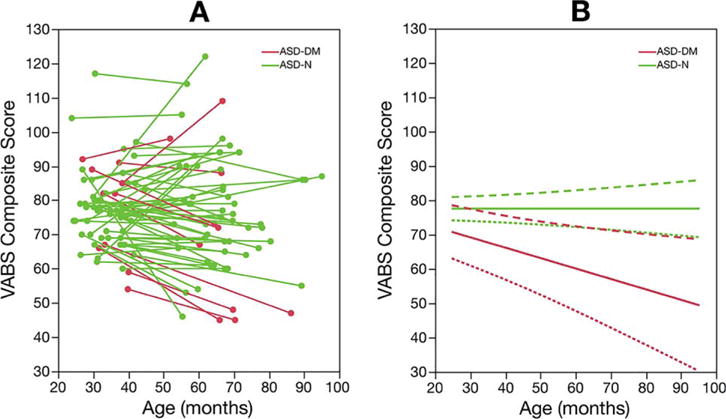
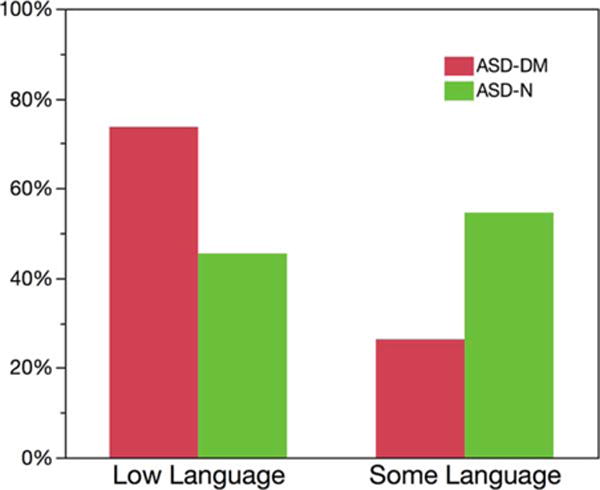
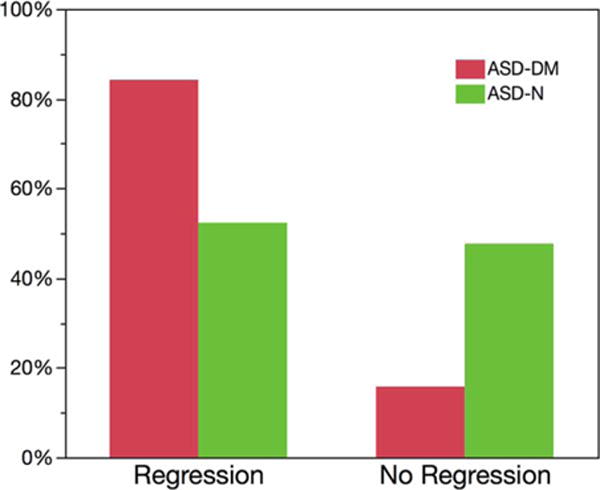
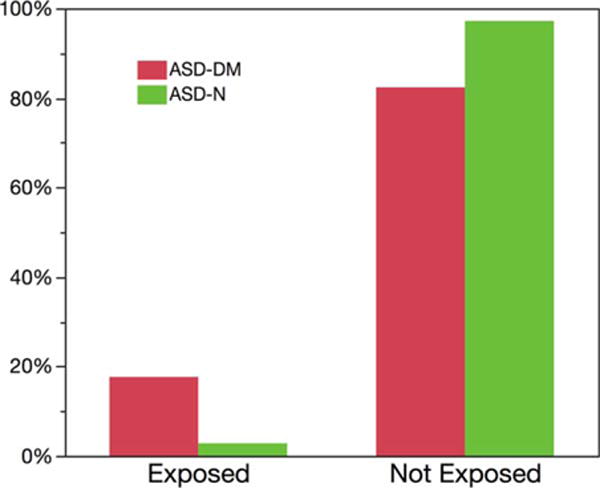
A consensus has emerged that despite common core features, autism spectrum disorder (ASD) has multiple etiologies and various genetic and biological characteristics. The fact that there are likely to be subtypes of ASD has complicated attempts to develop effective therapies. The UC Davis MIND Institute Autism Phenome Project is a longitudinal, multidisciplinary analysis of children with autism and age-matched typically developing controls; nearly 400 families are participating in this study. The overarching goal is to gather sufficient biological, medical, and behavioral data to allow definition of clinically meaningful subtypes of ASD. One reasonable hypothesis is that different subtypes of autism will demonstrate different patterns of altered brain organization or development i.e., different neurophenotypes. In this Commentary, we discuss one neurophenotype that is defined by megalencephaly, or having brain size that is large and disproportionate to body size. We have found that 15% of the boys with autism demonstrate this neurophenotype, though it is far less common in girls. We review behavioral and medical characteristics of the large-brained group of boys with autism in comparison to those with typically sized brains. While brain size in typically developing individuals is positively correlated with cognitive function, the children with autism and larger brains have more severe disabilities and poorer prognosis. This research indicates that phenotyping in autism, like genotyping, requires a very substantial cohort of subjects. Moreover, since brain and behavior relationships may emerge at different times during development, this effort highlights the need for longitudinal analyses to carry out meaningful phenotyping. Autism Res 2017, 10: 711-722. © 2017 International Society for Autism Research, Wiley Periodicals, Inc.

Keywords: brain development; magnetic resonance imaging; megalencephaly; phenotype; subtypes.


Conflict of interest statement

The authors have no conflict of interest regarding the contents of this manuscript.

Figures

Figure 1
Figure 1
Ratio of total cerebral volume to height for boys with ASD and disproportionate megalencephaly (ASD-DM, N = 19), boys with ASD and normal brain size (ASD-N, N = 110) and typically developing (TD, N = 49) boys at Time 1 in the Autism Phenome Project. The blue shaded region indicates values within 1.5 standard deviations of the typically developing mean. A TCV to height ratio above the upper boundary of this region is what we have defined as disproportionate megalencephaly.
Figure 2
Figure 2
Distribution of subject total brain volume (TCV) to height ratios and the percentage of APP boys (ASD and TD) in each bin. Reproduced from Libero et al. [2016].
Figure 3
Figure 3
Longitudinal analyses of total cerebral volume for subgroups. (A) Total cerebral volume data for the three subgroups: ASD-DM, ASD-N, and TD boys. Each line connects the data points from each individual subject. The ASD-DM group (red) falls in the upper end of the distribution, while there is almost complete overlap between the ASD-N (green) and TD (blue) participants. (B) Individual subject data are represented as individual data points. The lines represent the predicted growth trajectories of total cerebral volume for each of the three subgroups, ASD-DM, ASD-N, and TD. ASD-DM boys had significantly greater TCV at the earliest age and also a significantly greater rate of growth from ages 3 to 5 years, compared to ASD-N and TD boys. Reproduced from Libero et al. [2016].
Figure 4
Figure 4
Longitudinal analyses of head circumference for subgroups. (A) Data for head circumference for participants from each of the three subgroups: ASD-DM, ASD-N, and TD. Each line connects the data points from each individual subject. The ASD-DM group (red) fall in the upper end of the distribution, while there is a large amount of overlap between the ASD-N (green) and TD (blue) boys. (B) Predicted growth trajectories for head circumference for each of the three subgroups. Dashed lines indicate the lower and upper bounds of the 95% confidence intervals. The ASD-DM group did not differ in head circumference at birth, but reached a significantly larger head size compared to the ASD-N and TD boys. Reproduced from Libero et al. [2016] as in Figures 2 and 3.
Figure 5
Figure 5
IQ measurement was assessed using the Mullen Scales of Early (MSEL) Learning during the Time 1 evaluations and the Differential Ability Scales (DAS) during the Time 3 evaluations of the APP boys. (A) Change in IQ scores (utilizing standard scores from the MSEL and DAS) from Time 1 to Time 3 in the ASD-DM (red) and ASD-N (green) groups. Each dot represents an individual subject. The gray line illustrates the negative correlation (r(76) = −0.315, P = .005) between change in IQ scores and the TCV/height ratio among all ASD subjects. The gray region represents the 95% confidence interval of this relationship. (B) Mean increase in IQ from Time 1 to Time 3 in the ASD-DM and ASD-N groups. (C) Observed trajectories of IQ change for the ASD-DM and ASD-N groups. Each line connects the data points from each individual subject. (D) Predicted trajectories of IQ change for the ASD-DM and ASD-N groups (solid line). The dashed lines represent the upper limit of the 95% confidence interval for the two groups while the dotted lines represent the lower limit. The ASD-N group had a significantly greater rate of IQ change compared to the ASD-DM group.
Figure 6
Figure 6
Relationship between total cerebral volume (TCV) and developmental quotient (DQ) at Time 1. For the typically developing boys (in blue), there is a positive correlation (r(47) = 0.35, P = .02) between total cerebral volume and DQ. In contrast, for the ASD-DM group (in red) as well as the ASD-N group (in green) there is no significant association between brain size and DQ.
Figure 7
Figure 7
Relationship between the TCV/height ratio and the ADOS severity score at Time 1 (A) and Time 3 (B) evaluations. No correlation was observed for either subgroup at either time point.
Figure 8
Figure 8
(A) Observed trajectories of Vineland Adaptive Behavior Scales (VABS) Adaptive Behavior Composite scores between Time 1 and 3 for the ASD-DM and ASD-N groups. Each line represents an individual subject. (B) Predicted trajectories of VABS Adaptive Behavior Composite scores for the ASD-DM and ASD-N groups (solid line). The dashed lines represent the upper limit of the 95% confidence interval for the two groups while the dotted lines represent the lower limit. The ASD-DM group had a significant decrease in the rate of change compared to the ASD-N group.
Figure 9
Figure 9
The percentage of boys with ASD-DM (red) or with ASD-N (green) who were classified as having either low language or having some language ability.
Figure 10
Figure 10
The percentage of boys with ASD-DM (red) and ASD-N (green) who had a regressive versus no regressive component reported for the onset of their autism.
Figure 11
Figure 11
The percentage of boys with ASD-DM (red) and ASD-N (green) who were, or were not, exposed to autism-related maternal antibodies.

References

    1. Accardo JA, Malow BA. Sleep, epilepsy, and autism. Epilepsy & Behavior: E&B. 2015;47:202–206. - PubMed
    1. Bauman MD, Iosif AM, Ashwood P, Braunschweig D, Lee A, Schumann CM, Amaral DG. Maternal antibodies from mothers of children with autism alter brain growth and social behavior development in the rhesus monkey. Translational Psychiatry. 2013;3:e278. - PMC - PubMed
    1. Bernier R, Golzio C, Xiong B, Stessman HA, Coe BP, Penn O, Eichler EE. Disruptive CHD8 mutations define a subtype of autism early in development. Cell. 2014;158:263–276. - PMC - PubMed
    1. Beversdorf DQ, Missouri Autism Summit C Phenotyping, etiological factors, and biomarkers: Toward precision medicine in autism spectrum disorders. Journal of Developmental & Behavioral Pediatrics. 2016;37:659–673. - PMC - PubMed
    1. Braunschweig D, Ashwood P, Krakowiak P, Hertz-Picciotto I, Hansen R, Croen LA, Van de Water J. Autism: Maternally derived antibodies specific for fetal brain proteins. Neurotoxicology. 2008;29:226–231. - PMC - PubMed

MeSH terms