. 2017 Mar 21;62(6):2465-2485.
doi: 10.1088/1361-6560/aa5e46. Epub 2017 Feb 27.

Quantitative image reconstruction for total-body PET imaging using the 2-meter long EXPLORER scanner

Affiliations

Quantitative image reconstruction for total-body PET imaging using the 2-meter long EXPLORER scanner

Xuezhu Zhang et al. Phys Med Biol. .

Abstract

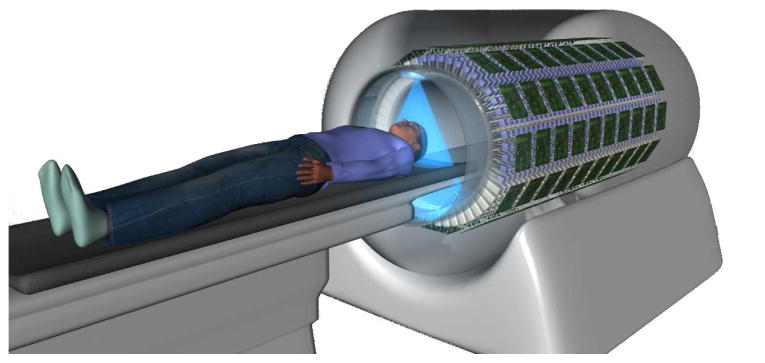
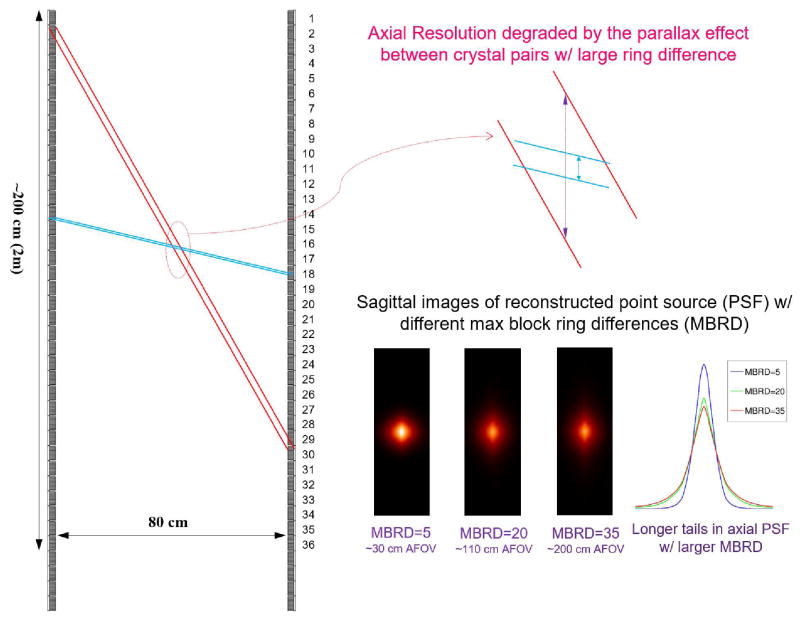
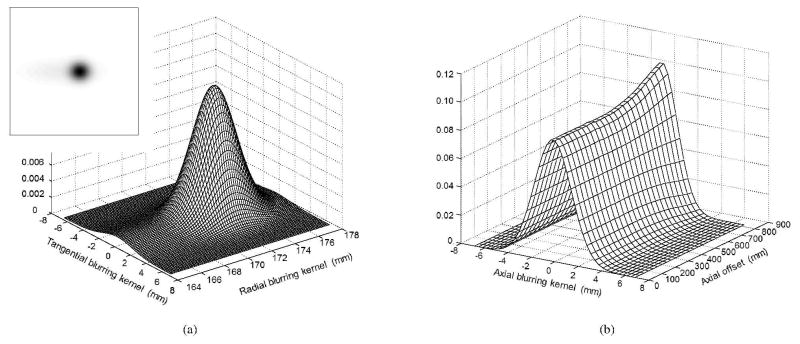
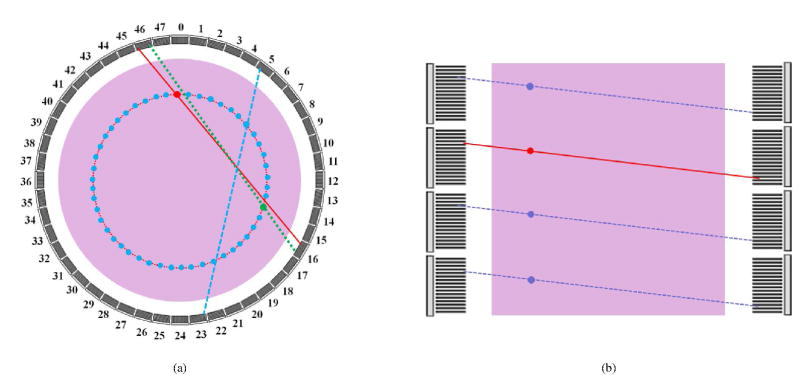
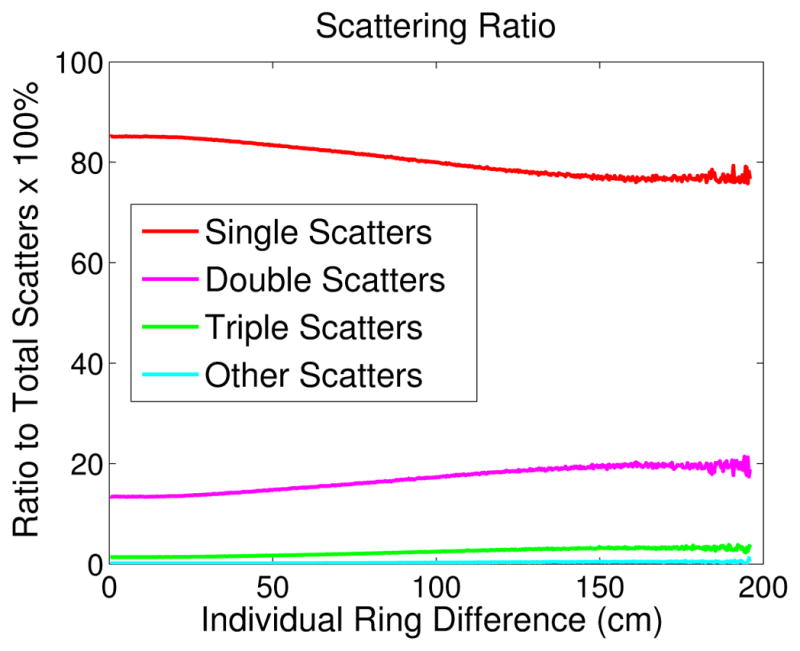
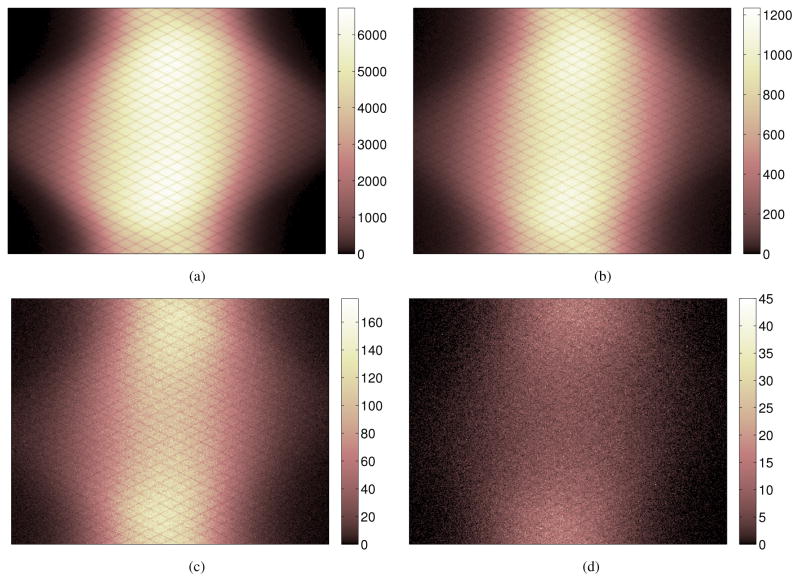
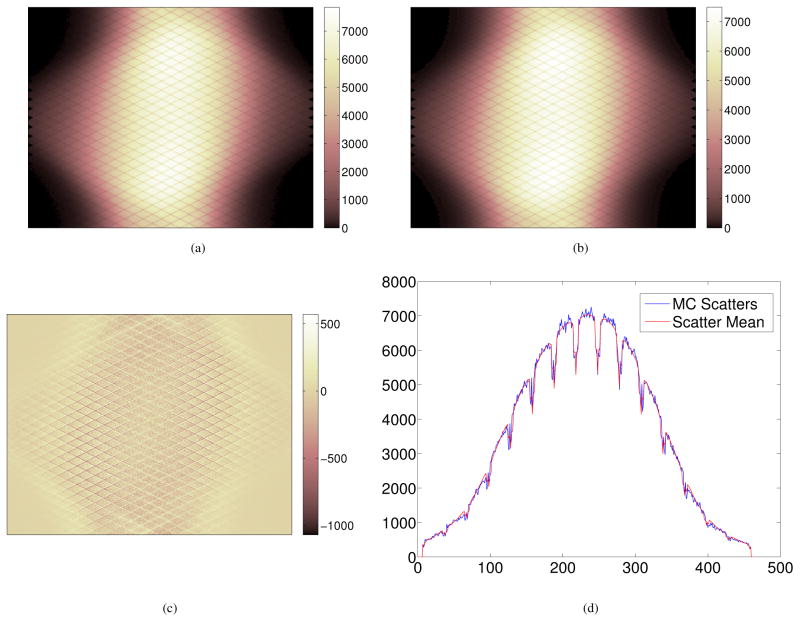
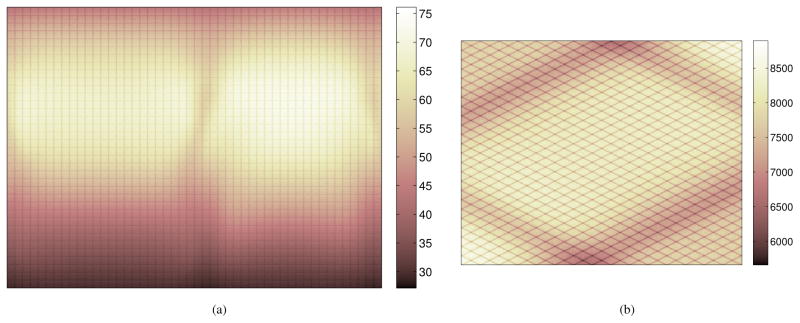
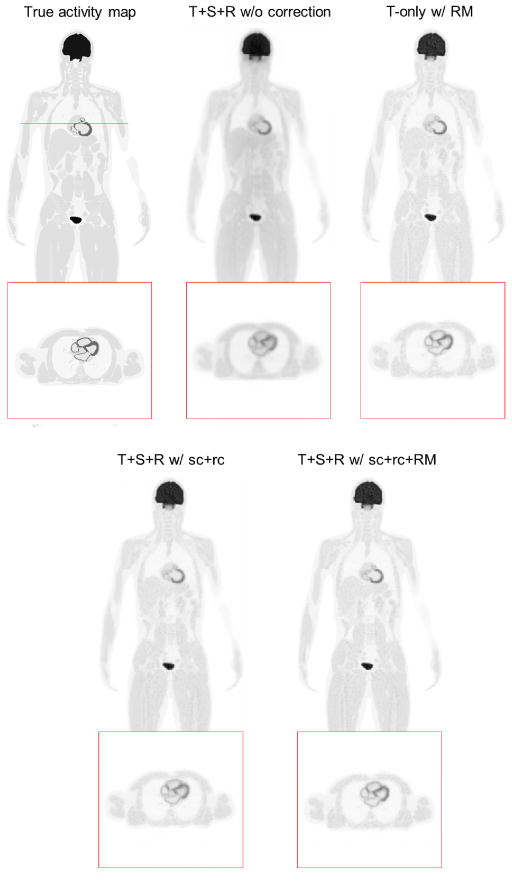
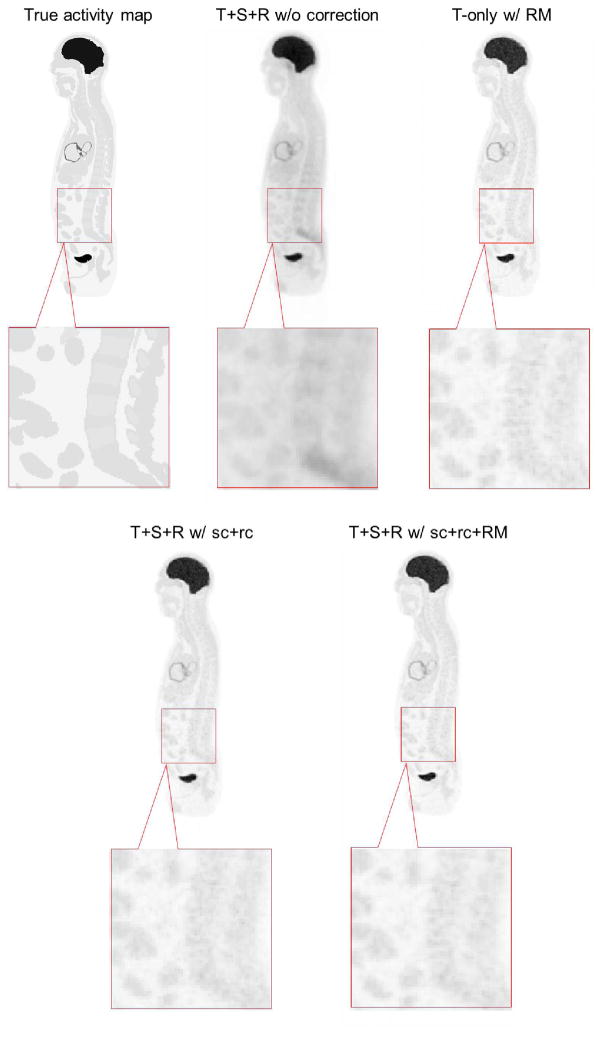
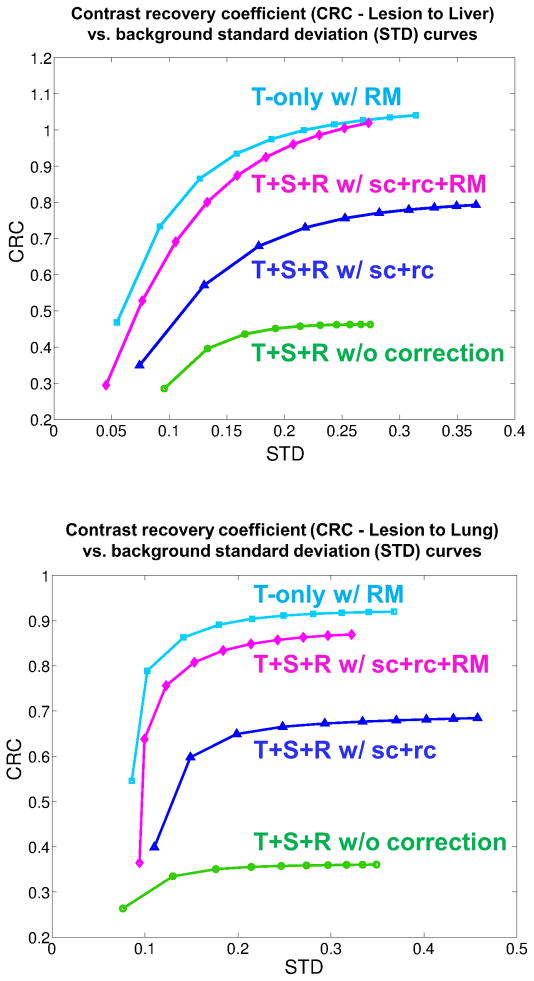
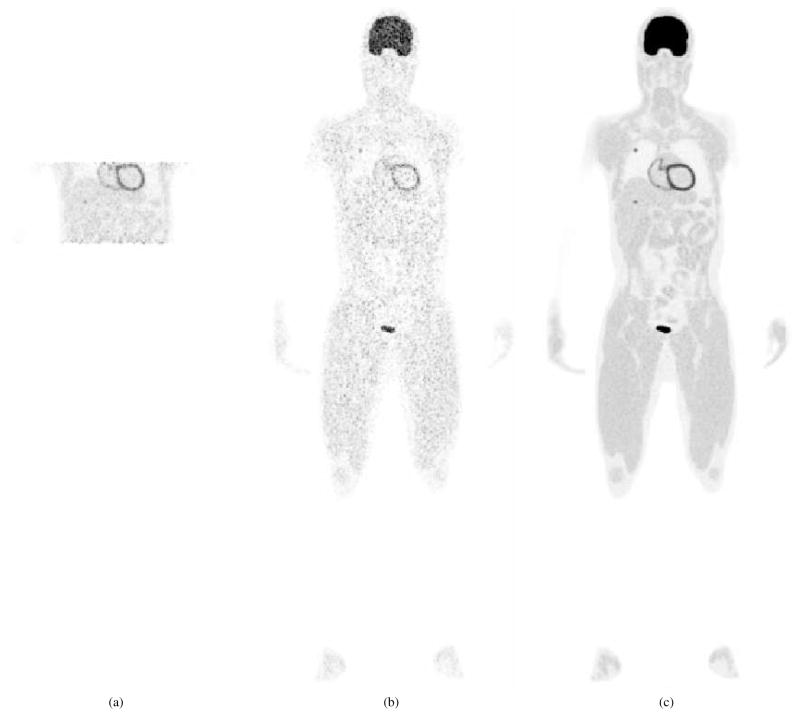
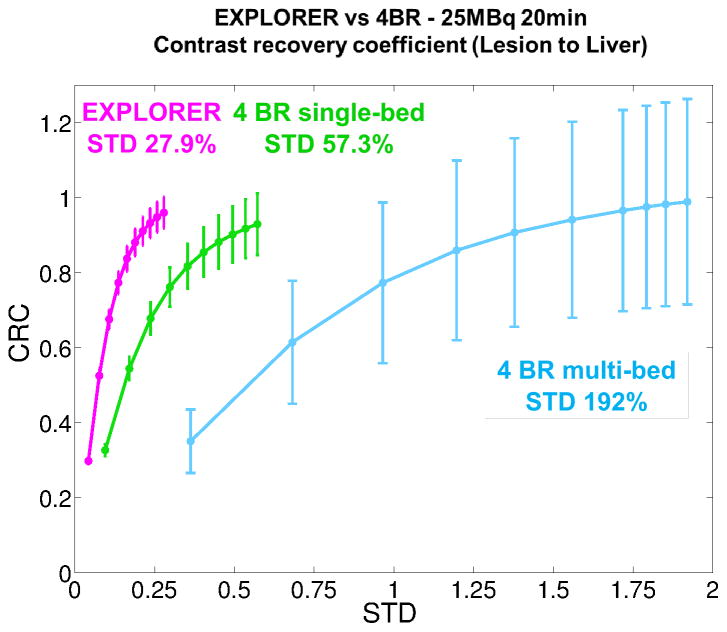
The EXPLORER project aims to build a 2 meter long total-body PET scanner, which will provide extremely high sensitivity for imaging the entire human body. It will possess a range of capabilities currently unavailable to state-of-the-art clinical PET scanners with a limited axial field-of-view. The huge number of lines-of-response (LORs) of the EXPLORER poses a challenge to the data handling and image reconstruction. The objective of this study is to develop a quantitative image reconstruction method for the EXPLORER and compare its performance with current whole-body scanners. Fully 3D image reconstruction was performed using time-of-flight list-mode data with parallel computation. To recover the resolution loss caused by the parallax error between crystal pairs at a large axial ring difference or transaxial radial offset, we applied an image domain resolution model estimated from point source data. To evaluate the image quality, we conducted computer simulations using the SimSET Monte-Carlo toolkit and XCAT 2.0 anthropomorphic phantom to mimic a 20 min whole-body PET scan with an injection of 25 MBq 18F-FDG. We compare the performance of the EXPLORER with a current clinical scanner that has an axial FOV of 22 cm. The comparison results demonstrated superior image quality from the EXPLORER with a 6.9-fold reduction in noise standard deviation comparing with multi-bed imaging using the clinical scanner.


Figures

Figure 1
Figure 1
Artistic illustration of the EXPLORER system.
Figure 2
Figure 2
Axial resolution blurring effect occurred at center of the FOV for different maximum ring difference. The point source images were reconstructed using 30 iterations of a LM TOF ML-EM algorithm.
Figure 3
Figure 3
Examples of the estimated image domain resolution kernels. (a) 2D transaxial radial blurring kernel at 17.2 cm radial offset; (b) 1D axial blurring kernels from the center to 90 cm axial offset (MBRD=20).
Figure 4
Figure 4
An illustration of LORs sharing the same normalization factors with the transaxial and axial symmetries. (a) The original LOR of the detected event (red solid line), 48-fold angular (blue dashed line) and 2-fold reflection (green dotted line) symmetries. (b) axial parallel symmetry with same ring difference (dashed lines).
Figure 5
Figure 5
One transaxial sinogram of the simulated uniform cylinder for normalization (BRD=2). (a) The sinogram with axial symmetry only (34-fold). (b) The sinogram with both axial symmetry and transaxial symmetry (3,264-fold). The left figure aims to demonstrate the significant reduction in statistical uncertainty obtained by using the symmetry operations.
Figure 6
Figure 6
XCAT 2.0 phantom used for the total-body simulation. Two lesions were added in the right lung and liver (marked by red circles).
Figure 7
Figure 7
Illustration of the three scan protocols. (a) 4BR single-bed torso scan; (b) 4BR multi-bed whole-body scan; (c) the EXPLORER total-body scan.
Figure 8
Figure 8
(a) The numbers of trues (T) and scatters (S) in the direct/oblique sinograms as a function of ring difference. (b) Scatter fraction S/(S+T) in individual sinograms as a function of ring difference (red curve) and in all sinograms for a given maximum ring difference (blue curve).
Figure 9
Figure 9
Fractions of single scatters and multiple scatters as a function of ring difference.
Figure 10
Figure 10
Sinogram summed in the axial direction: (a) Single scatters (412 million); (b) double scatters (71 million); (c) triple scatters (8 million); (d) other scatters (0.74 million).
Figure 11
Figure 11
Comparison of the reference scatter sinogram from Monte Carlo simulation and the block-pair averaged scatter mean sinogram summed in the axial direction. (a) The reference MC scatter sinogram (494 million); (b) the estimated scatter mean from 5D linear interpolation of block-pair sinogram; (c) the difference sinogram between (b) and (a); (d) profiles along the central row in (a) and (b).
Figure 12
Figure 12
(a) Simulated singles rate map from the combination of the object and LSO background. The vertical axis represents 36 axial block rings and the horizontal axis represents 48 transaxial blocks/ring, with each block consisting of 15×15 crystals. (b) The axial sum of the random sinogram.
Figure 13
Figure 13
One realization showing reconstructed coronal and transaxial images with different levels of quantitative correction. Gaussian post-smoothing (σ = 0.6 pixel) was applied for better visualization.
Figure 14
Figure 14
One realization showing reconstructed sagittal images with different levels of quantitative correction. Gaussian post-smoothing (σ = 0.6 pixel) was applied for better visualization.
Figure 15
Figure 15
A comparison of CRC vs. background STD in the reconstructed images with different levels of quantitative correction. Top: the liver lesion; bottom: the lung lesion.
Figure 16
Figure 16
Reconstructed images from three scan protocols. (a) 4BR single-bed scan; (b) 4BR multi-bed whole-body scan; (c) the EXPLORER total-body scan. Gaussian post-smoothing (σ = 0.6 pixel) was applied for better visualization.
Figure 17
Figure 17
A comparison of CRC vs. background STD of a clinical scanner with four block rings (4BR) and the EXPLORER.

References

    1. Badawi RD, Kohlmyer SG, Harrison RL, Vannoy SD, Lewellen TK. The effect of camera geometry on singles flux, scatter fraction, and trues and randoms sensitivity of cylindrical 3D PET–a simulation study. IEEE Trans Nucl Sci. 2000;47:1228–32. doi: 10.1109/23.856575. - DOI
    1. Badawi RD, Poon JK, Surti S, Zhang X, Karp JS, Moses WW, Qi J, Graham M, Mankoff D, Wahl RL, Jagust W, Budinger TF, Jones T, Cherry SR. EXPLORER – An Ultrasensitive Total-Body PET scanner: Application Feasibility Simulations. World Molecular Imaging Congress. 2013 LBAP 125.
    1. Bai B, Lin Y, Zhu W, Ren R, Li Q, Dahlbom M, DiFilippo F, Leahy RM. MAP reconstruction for Fourier rebinned TOF-PET data. Phys Med Biol. 2014;59:925–49. doi: 10.1088/0031-9155/59/4/925. - DOI - PMC - PubMed
    1. Borasi G, Fioroni F, Del Guerra A, Lucignani G. PET systems: the value of added length. Eur J Nucl Med Mol Imaging. 37:1629–32. doi: 10.1007/s00259-010-1438-9. - DOI - PubMed
    1. Cherry SR. The 2006 Henry N Wagner lecture: of mice and men (and positrons)–advances in PET imaging technology. J Nucl Med. 2006;47:1735–45. - PubMed

MeSH terms

Substances