. 2017 Feb 27:8:14420.
doi: 10.1038/ncomms14420.

Nur77 suppresses hepatocellular carcinoma via switching glucose metabolism toward gluconeogenesis through attenuating phosphoenolpyruvate carboxykinase sumoylation

Affiliations

Nur77 suppresses hepatocellular carcinoma via switching glucose metabolism toward gluconeogenesis through attenuating phosphoenolpyruvate carboxykinase sumoylation

Xue-Li Bian et al. Nat Commun. .

Abstract

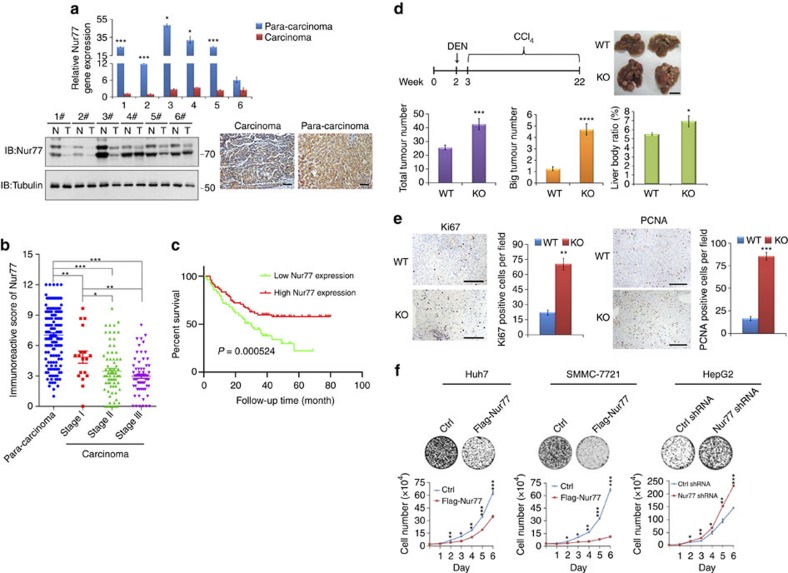
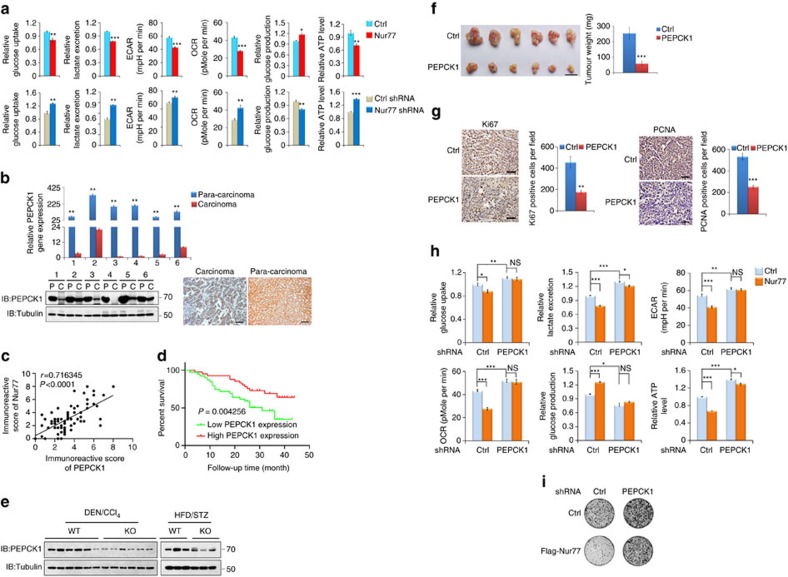
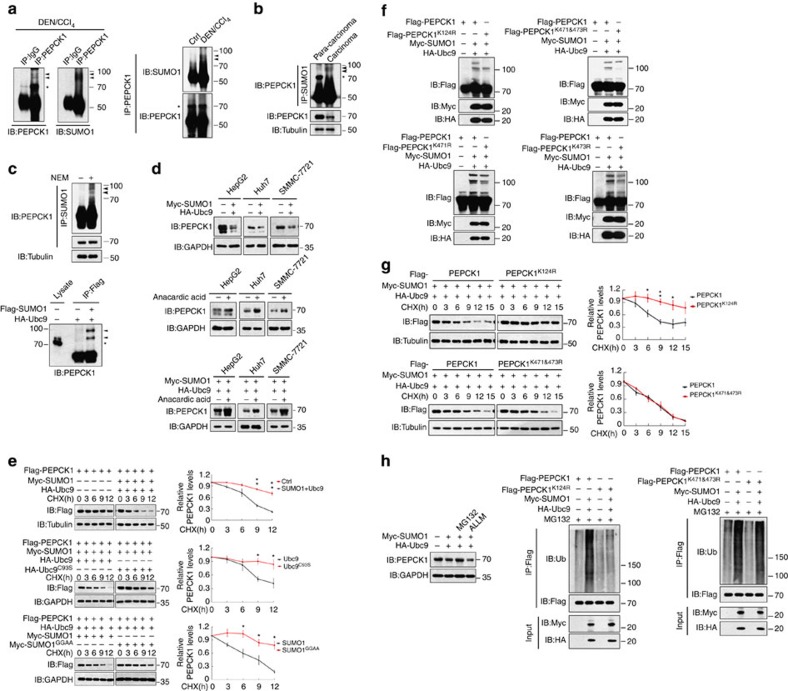
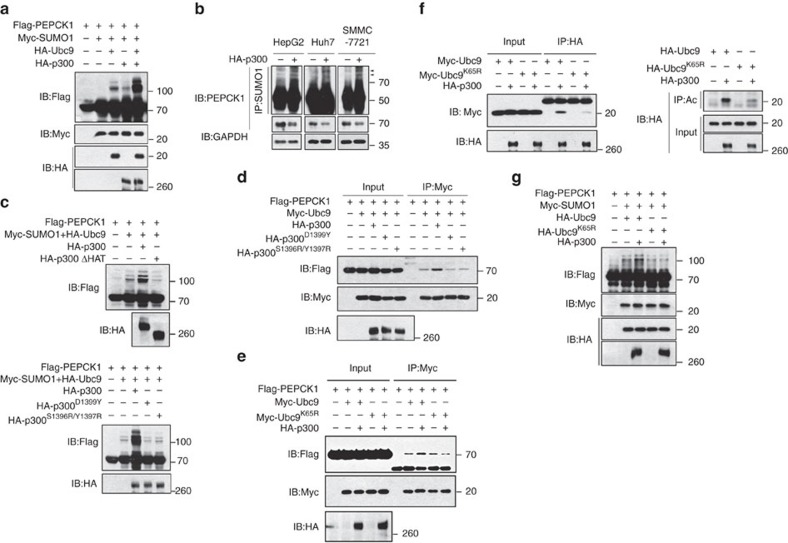
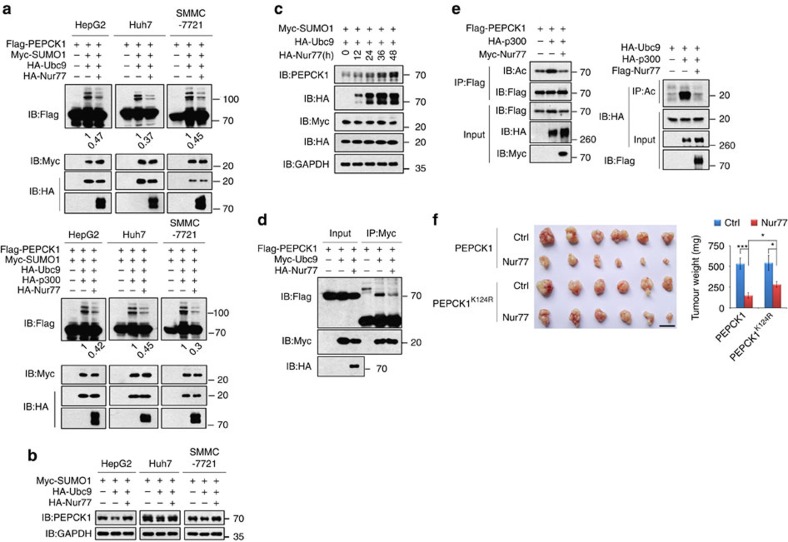
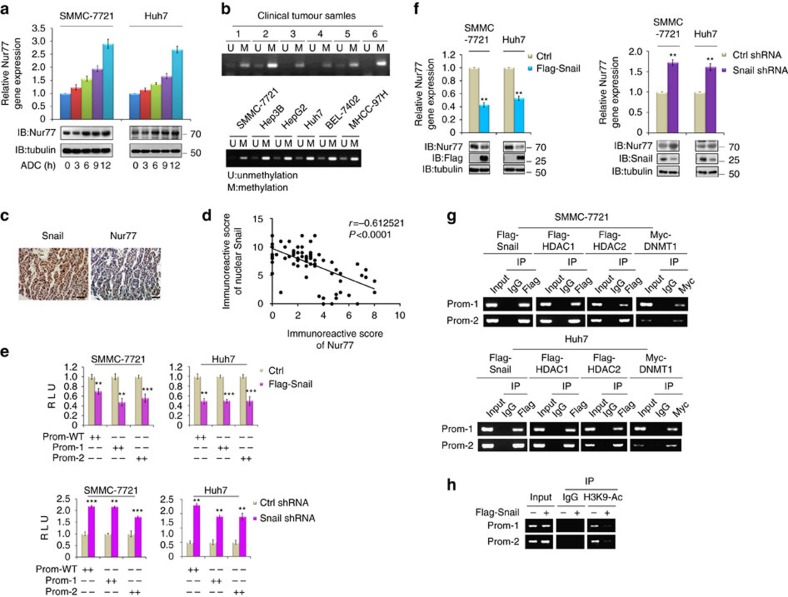
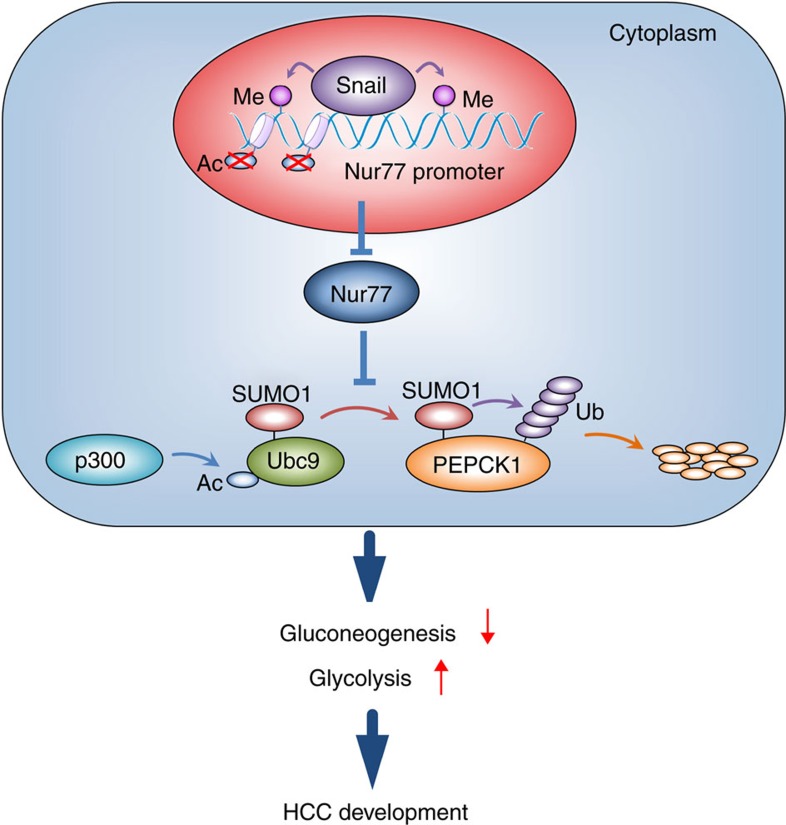
Gluconeogenesis, an essential metabolic process for hepatocytes, is downregulated in hepatocellular carcinoma (HCC). Here we show that the nuclear receptor Nur77 is a tumour suppressor for HCC that regulates gluconeogenesis. Low Nur77 expression in clinical HCC samples correlates with poor prognosis, and a Nur77 deficiency in mice promotes HCC development. Nur77 interacts with phosphoenolpyruvate carboxykinase (PEPCK1), the rate-limiting enzyme in gluconeogenesis, to increase gluconeogenesis and suppress glycolysis, resulting in ATP depletion and cell growth arrest. However, PEPCK1 becomes labile after sumoylation and is degraded via ubiquitination, which is augmented by the p300 acetylation of ubiquitin-conjugating enzyme 9 (Ubc9). Although Nur77 attenuates sumoylation and stabilizes PEPCK1 via impairing p300 activity and preventing the Ubc9-PEPCK1 interaction, Nur77 is silenced in HCC samples due to Snail-mediated DNA methylation of the Nur77 promoter. Our study reveals a unique mechanism to suppress HCC by switching from glycolysis to gluconeogenesis through Nur77 antagonism of PEPCK1 degradation.


Conflict of interest statement

The authors declare no competing financial interests.

Figures

Figure 1
Figure 1. Nur77 is a tumour suppressor for hepatocellular carcinoma.
(a) The expression levels of Nur77 gene (top) and protein (bottom) in clinical HCC (C) and paired para-carcinoma (P) samples detected by real-time PCR (top) or western blot and immunohistochemical staining (bottom). Scale bars, 100 μm. Tubulin was used to indicate the amount of loading proteins. (b) Scatter plot analysis of the immunoreactive score (IRS) of Nur77 in 159 para-carcinoma samples and 159 HCC samples grouped into stage I-III. (c) Kaplan-Meier survival curve shows the positive correlation between overall survival of HCC patients and Nur77 expression levels. Patients with Nur77 expression values below the 50th percentile were classified as lower Nur77 levels, while above the 50th percentile were classified as higher Nur77 levels. The median expression level was used as the cutoff. Survival information of 159 patients is available. (d) Top, the schematic overview of DEN/CCl4 HCC mice model (left) and liver images (right). Bottom, tumour numbers and big tumour numbers (diameter >5 mm), ratio of liver:body weight in DEN/CCl4-induced HCC mice (n=10). Scale bars, 1 cm. (e) Ki67 and PCNA expression levels in liver samples from DEN/CCL4-induced HCC mice. Positive cells were quantified in 20 randomly selected fields per mouse (n=6). Scale bars, 100 μm. (f) Nur77 inhibits proliferation of liver cancer cells determined by colony formation (top) and cell counting (bottom). Nur77 was stably expressed in Huh7 and SMMC-7721 cells or knocked down in HepG2 cells. Data were represented as means±s.e.m. of at least three independent experiments. *P<0.05; **P<0.01; ***P<0.001. The data were analysed using one-way ANOVA followed by Tukey post hoc test in (a,b,f) and two-tailed Student's t-test in (d,e).
Figure 2
Figure 2. Nur77 regulates metabolism of hepatocarcinogenesis through PEPCK1.
(a) Analysis of glucose uptake and production, lactate excretion, ECAR, OCR and ATP level separately in Huh7 cells with Nur77 overexpression (top) or HepG2 cells with Nur77 knockdown (bottom). The ECAR bar values represent the glycolytic capacity, and the OCR bar values represent the ATP production-related oxygen consumption. The seahorse tracing curves of ECAR and OCR were shown in Supplementary Fig. 2a. (b) The expression levels of Pepck1 gene (top) and protein (bottom) in clinical HCC (C) and paired para-carcinoma (P) samples were detected by real-time PCR (top) or western blot and immunohistochemical staining (bottom). Tubulin was used to indicate the amount of loading proteins. Scale bars, 100 μm. (c) The positive correlation of protein expression levels between Nur77 and PEPCK1 in HCC samples (n=82). (d) Kaplan-Meier survival curve shows the positive correlation between overall survival of HCC patients and PEPCK1 expression levels. Survival information of 82 patients is available. (e) Endogenous PEPCK1 expression levels in HCC samples from DEN/CCl4- and HFD/STZ-induced WT and Nur77-KO mice. (f) Images (left) and weight (right) of xenograft tumour in nude mice (n=6). PEPCK1 was overexpressed in Huh7 cells that were then injected subcutaneously into the posterior flanks of nude mice. Scale bars, 1 cm. (g) The proliferative status of tumours is evaluated by Ki67 and PCNA immunohistochemical staining in xenograft tumour of nude mice. Positive cells were quantified in 20 randomly selected fields per mouse (n=6). Scale bars, 25 μm. (h,i) PEPCK1 was knocked down first and then Nur77 was overexpressed in Huh7 cells. The glucose uptake and production, lactate excretion, ECAR, OCR and ATP level (h), as well as cell proliferation (i) were measured, respectively. Tubulin was used to indicate the amount of loading proteins. Data were represented as means±s.e.m. of at least three independent experiments or of mice in the number indicated in the parenthesis. *P<0.05; **P<0.01; ***P<0.001. The data were analysed using two-tailed Student's t-test in (a,f,g), one-way ANOVA followed by Tukey post hoc test in (b,h) and Pearson's chi-squared test in (c).
Figure 3
Figure 3. Sumoylation induces PEPCK1 degradation.
(a) In DEN/CCl4-induced HCC samples (left) or normal livers (Ctrl) versus DEN/CCl4-induced HCC samples (right), endogenous PEPCK1 was first immunoprecipitated and then incubated with anti-PEPCK1 antibody or anti-SUMO1 antobody, respectively. Asterisk represents position of PEPCK1 protein; arrowheads indicate sumoylation bands. (b) The levels of PEPCK1 and its sumoylation in clinical carcinoma and paired para-carcinoma samples. Endogenous SUMO1 was immunoprecipitated and then incubated with anti-PEPCK1 antibody. (c) Top, HepG2 cell lysates with or without NEM (20 mM) was immunoprecipitated with anti-SUMO1 antibody and then incubated with anti-PEPCK1 antibody. Bottom, SUMO1 and Ubc9 were transfected into 293T cells, and Flag-SUMO1 was immunoprecipitated and then detected by western blot with anti-PEPCK1 antibody. (d) Sumoylation effect on endogenous PEPCK1 expression in different liver cancer cell lines that were transfected with SUMO1/Ubc9 (top) or treated with sumoylation inhibitor, anacardic acid (20 μM, 12 h) with or without SUMO1/Ubc9 transfection (middle and bottom). (e) Sumoylation attenuated PEPCK1 stability in SMMC-7721 cells that were transfected with different plasmids and then treated with CHX (100 μg ml−1) for different times (left). The amount of PEPCK1 protein was quantitated by software Image J (right). (f) Determination of the critical sites for PEPCK1 sumoylation in SMMC-7721 cells. The amount of PEPCK1 protein was normalized in each panel. (g) Lys124 site was important to stabilize PEPCK1 protein in SMMC-7721 cells with CHX (100 μg ml−1) treatment. (h) Sumoylation-induced PEPCK1 degradation via ubiquitination pathway in SMMC-7721 cells that were treated with MG132 (5 μM) or ALLM (20 μM) for 12 h. The expression level of PEPCK1 (left) or ubiquitination levels of PEPCK1, PEPCK1K124R and PEPCK1K471&473R (middle and right) were detected. NEM (20 mM) was added to cell lysates for repression of de-sumoylation in each sumoylation assay. Tubulin or GAPDH was used to indicate the amount of loading proteins. Data were represented as means±s.e.m. of at least three independent experiments. *P<0.05; **P<0.01. The data were analysed using one-way ANOVA followed by Tukey post hoc test.
Figure 4
Figure 4. p300 enhances PEPCK1 sumoylation.
(a) p300-enhanced SUMO1/Ubc9-induced sumoylation in 293T cells. Different plasmids were transfected into cells, the sumoylation was indicated. (b) p300 inhibited endogenous SUMO1 and PEPCK1 levels in different liver cancer cell lines. p300 was transfected into cells and SUMO1 was immunoprecipetated and endogenous PEPCK1 sumoylation was indicated by its antibody. (c) p300-enhanced PEPCK1 sumoylation was dependent on its acetyltransferase activity. Different p300 inactive mutants were transfected into 293T cells as indicated. (d) p300 acetyltransferase activity was critical to enhance Ubc9 binding to PEPCK1 in 293T cells. (e) p300 could promote Ubc9, but not Ubc9K65R, binding to PEPCK1 in 293T cells. (f) p300 interacted with Ubc9K65R less than with Ubc9 in 293T cells (left), and p300 could acetylate Ubc9 but not Ubc9K65R, detected with anti-acetylation antibody (Ac, right). (g) Ubc9K65R had no effect on p300-enhanced PEPCK1 sumoylation in 293T cells. NEM (20 mM) was added to cell lysates for repression of de-sumoylation in each sumoylation assay.
Figure 5
Figure 5. Activation of Nur77 attenuates PEPCK1 sumoylation and stabilizes PEPCK1.
(a) Nur77 abolished SUMO1/Ubc9-induced sumoylation (top), and p300-enhanced sumoylation (bottom) in different liver cancer cell lines. The amount of PEPCK1 sumoylation was quantitated by software Image J and presented under lanes of PEPCK1. (b) The role of Nur77 in elevating endogenous PEPCK1 expression levels in different liver cancer cell lines that were transfected with SUMO1 and Ubc9. (c) Nur77 elevated PEPCK1 protein expression in a time-dependent manner in HepG2 cells that were transfected with SUMO1 and Ubc9. (d) Nur77 blocked Ubc9 binding to PEPCK1 in 293T cells detected by co-IP assay. (e) Nur77 impaired p300 acetylation effect on PEPCK1 (left) or Ubc9 (right) detected with specific anti-acetylated lysine antibody (Ac) in 293T cells. (f) Images (left) and weight (right) of xenograft tumour in nude mice (n=6). PEPCK1 or PEPCK1 K124R was stably overexpressed in Huh7 cells, and then Nur77 was further stably transfected into these cells. Cells were injected subcutaneously into the posterior flanks of nude mice. Scale bars, 1 cm. NEM (20 mM) was added to cell lysates for repression of de-sumoylation in each sumoylation assay. GAPDH was used to indicate the amount of loading proteins. Data were represented as means±s.e.m. of mice in the number indicated in the parenthesis. *P<0.05; ***P<0.001. The data were analysed using one-way ANOVA followed by Tukey post hoc test.
Figure 6
Figure 6. Snail downregulates Nur77 gene expression via methylation pathway.
(a) The expression levels of Nur77 mRNA (top) and protein (bottom) in SMMC-7721 and Huh7 cells that were treated with ADC (10 μM) for indicated times. (b) Detection of methylation by methylation-specific PCR in clinical samples (top) and different liver cancer cell lines (bottom). U, unmethylation; M, methylation. (c) Snail and Nur77 expression levels detected in the same clinical HCC sample. Scale bars, 100 μm. (d) The negative correlation between the nuclear Snail and the protein levels of Nur77 in 82 clinical HCC samples. (e) Different reporters of Nur77 promoter, constructed as shown in Supplementary Fig. 6a, were transfected into Snail overexpression (top) or Snail knockdown (bottom) SMMC-7721 and Huh7 cell lines, and luciferase assays were perform to determine Nur77 promoter activity. (f) Overexpression of Snail (left) or knockdown of Snail (right) in SMMC-7721 and Huh7 cells affected expression levels of Nur77 gene (top) and protein (bottom). (g) The recruitment of Snail, HDAC1, HDAC2 or DNMT1 to Nur77 promoter revealed by ChIP assays in SMMC-7721 and Huh7 cells. (h) Snail-mediated deacetylation of H3K9 on Nur77 promoter in Huh7 cells detected by ChIP assays. Tubulin was used to indicate the amount of loading proteins. Data were represented as means±s.e.m. of at least three independent experiments. *P<0.05; **P<0.01; ***P<0.001. The data were analysed using one-way ANOVA followed by Tukey post hoc test in (e,f) and Pearson's chi-squared test in (d).
Figure 7
Figure 7. The functional model of Snail-Nur77-PEPCK1 pathway.
In HCC, PEPCK1 was sumoylated and p300 enhanced the sumoylation through acetylating Ubc9. Sumoylation led to PEPCK1 degradation via ubiquitination way, consequently boosted glycolysis and suppressed gluconeogenesis, promoted HCC development. Nur77 could stabilize PEPCK1 by competing Ubc9 binding to PEPCK1. Nevertheless, Snail with other factors suppressed expression of Nur77 gene through DNA methylation and histone deacetylation on Nur77 promoter.

References

    1. El-Serag H. B. & Rudolph K. L. Hepatocellular carcinoma: epidemiology and molecular carcinogenesis. Gastroenterology 132, 2557–2576 (2007). - PubMed
    1. Forner A., Llovet J. M. & Bruix J. Hepatocellular carcinoma. Lancet 379, 1245–1255 (2012). - PubMed
    1. Marquardt J. U. & Thorgeirsson S. S. SnapShot: hepatocellular carcinoma. Cancer Cell 25, 550 e551 (2014). - PubMed
    1. Hanahan D. & Weinberg R. A. Hallmarks of cancer: the next generation. Cell 144, 646–674 (2011). - PubMed
    1. Li B. et al.. Fructose-1,6-bisphosphatase opposes renal carcinoma progression. Nature 513, 251–255 (2014). - PMC - PubMed

Publication types

MeSH terms

Substances