. 2017 Feb 27:8:14519.
doi: 10.1038/ncomms14519.

Genome-wide identification of splicing QTLs in the human brain and their enrichment among schizophrenia-associated loci

Affiliations

Genome-wide identification of splicing QTLs in the human brain and their enrichment among schizophrenia-associated loci

Atsushi Takata et al. Nat Commun. .

Abstract

Detailed analyses of transcriptome have revealed complexity in regulation of alternative splicing (AS). These AS events often undergo modulation by genetic variants. Here we analyse RNA-sequencing data of prefrontal cortex from 206 individuals in combination with their genotypes and identify cis-acting splicing quantitative trait loci (sQTLs) throughout the genome. These sQTLs are enriched among exonic and H3K4me3-marked regions. Moreover, we observe significant enrichment of sQTLs among disease-associated loci identified by GWAS, especially in schizophrenia risk loci. Closer examination of each schizophrenia-associated loci revealed four regions (each encompasses NEK4, FXR1, SNAP91 or APOPT1), where the index SNP in GWAS is in strong linkage disequilibrium with sQTL SNP(s), suggesting dysregulation of AS as the underlying mechanism of the association signal. Our study provides an informative resource of sQTL SNPs in the human brain, which can facilitate understanding of the genetic architecture of complex brain disorders such as schizophrenia.


Conflict of interest statement

T.K. received a research grant from Takeda Pharmaceuticals Company Limited outside of this work. The remaining authors declare no competing financial interests.

Figures

Figure 1
Figure 1. Characterization of identified sQTL SNPs.
(a) Each blue dot indicates a SNP plotted according to its distance to the nearest AS event and statistical significance for association with AS (–log10 P-value). Red line indicates proportion of SNPs (%) that were classified as sQTL SNPs. Proportions in each 1,000 bp window were plotted. (b) Pie charts indicating proportions of SNPs annotated with each functional category (nonsense, readthrough, start-loss, frameshift, canonical splice site, missense, synonymous, splice region, 5′-UTR, 3′-UTR, non-coding exon, intron and intergenic). SNPs in exonic regions (nonsense, readthrough, start-loss, frameshift, canonical splice site, missense, synonymous, splice region, 5′-UTR, 3′-UTR and non-coding exon) and SNPs in non-exonic regions (intron and intergenic) are indicated by warm and cold colours, respectively. (c) Enrichment analyses of sQTL SNPs in each different functional type of variants. Exonic variants are shown in red and non-exonic variants are shown in blue. P-values were calculated by two-tailed Fisher's exact test with Bonferroni correction according to the number of functional types analysed (that is, ten types). Bars indicate 95% confidence intervals.
Figure 2
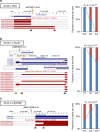
Figure 2. sQTL SNPs at canonical splice sites of genes with known transcript isoforms.
sQTL SNPs at the canonical splice sites of PPIG (a), C15orf57 (b) and CSRP2BP (c) controlling alternative usage of splice sites. Schematic of transcript isoforms at each locus (RefSeq Genes and Ensembl Gene Predictions tracks from the UCSC Genome Browser (https://genome.ucsc.edu/) with the genomic sequences and coordinates) are shown in the left panels. Orange arrows indicate the positions of sQTL SNPs. Arrowheads indicate alternative splice sites. In b, detailed sequences around three differently used splice sites (chr15: 40,856,965, 40,856,990 and 40,857,175) are shown in magnified view. Proportions of alternative splice sites used are shown in the right panels. The averages among the carriers of each genotype are shown as stacked bars. The colours of stacked bars (blue, red and green) correspond to the alternative splice sites (arrowheads) in the left panels. Double-corrected P-values (see Methods) are indicated above the bars.
Figure 3
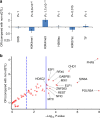
Figure 3. Enrichment analyses of sQTL SNPs among variants within genetic regulatory elements.
(a) Enrichment analysis of sQTL SNPs among variants within six types of regulatory elements (DNase I hypersensitive sites (DHS), H3K4 monomethylation marks (H3K4me1), H3K4 trimethylation marks (H3K4me3), H3K9 acetylation marks (H3K9ac), H3K27 acetylation marks (H3K27ac) and TF binding sites). P-values were calculated by two-tailed Fisher's exact test with Bonferroni correction according to the number of regulatory elements analysed (six elements). Bars indicate 95% confidence intervals. (b) Plots of −log10 P-values (x axis) and OR (y axis) obtained from enrichment analysis of sQTL SNPs among variants within binding sites for each TF. The dashed blue line indicates P=0.05 and the solid blue line indicates P=0.05/65=7.7 × 10−4 (Bonferroni-corrected P-value threshold, binding sites for a total of 65 TF were tested).
Figure 4
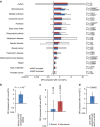
Figure 4. Enrichment analyses of sQTL SNPs among disease-associated loci.
(a) Results of enrichment analyses of sQTL SNPs among loci associated with 15 diseases/traits (nine diseases with the largest numbers of genome-wide significantly associated SNPs in the GWAS Catalog: breast cancer, colorectal cancer, inflammatory bowel disease, multiple sclerosis, prostate cancer, psoriasis, rheumatoid arthritis, schizophrenia and type 2 diabetes; four additional brain disorder groups: autism, Alzheimer's disease, bipolar disorder, Parkinson's disease; and two most intensively investigated non-disease traits: height and body mass index). Red and blue bars indicate the results from analyses including and excluding variants in the MHC locus, respectively. Results are shown in the order of OR from the analyses excluding MHC variants. Uncorrected P-values calculated by one-tailed Fisher's exact test are shown. *P<0.05 and **P<0.05/15=0.0033 (corresponding to the significance threshold considering the number of diseases/traits tested). (b) An enrichment analysis using the data of PGC GWAS instead of the data based on the GWAS Catalog. (c) Enrichment analyses dividing SNPs into exonic and non-exonic variants. (d) An enrichment analysis excluding sQTL SNPs associated with IRs. P-values were calculated by one-tailed Fisher's exact tests. Bars indicate 95% confidence intervals.
Figure 5
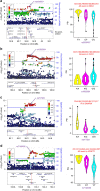
Figure 5. Utilization of sQTLs to localize candidate susceptibility genes for schizophrenia.
Local plots of the results of the PGC GWAS (left panels) and violin plots of PSI of AS in each genotype (right panels) for four loci encompassing AS of NEK4 (a), FXR1 (b), SNAP91 (c) and APOPT1 (d), which are controlled by sQTL SNPs in strong LD (r2>0.8) with the index SNPs in the GWAS. Local plot figures in the left panels were generated by LocusZoom. Each circle indicates a SNP that are colour-coded according to their LD (r2) with the sQTL SNP (indicated by purple arrows). The statistical strength of the association (–log10 P-values) and the recombination rate are double-plotted on the y axis. Blue horizontal lines indicate the genome-wide significance threshold (P=5 × 10⁻⁸). Genes in the UCSC Genome Browser (https://genome.ucsc.edu/) are shown in the panels below the local plots. Red lines indicate the positions of the associated AS events. Violin plots in the right panels show distributions of PSI in each genotype. The overlaid boxplots indicate the median (horizontal black lines) and interquartile range (IQR; white boxes). Outliers are shown as black dots.

References

    1. Barbosa-Morais N. L. et al. The evolutionary landscape of alternative splicing in vertebrate species. Science 338, 1587–1593 (2012). - PubMed
    1. Merkin J., Russell C., Chen P. & Burge C. B. Evolutionary dynamics of gene and isoform regulation in mammalian tissues. Science 338, 1593–1599 (2012). - PMC - PubMed
    1. GTEx Consortium. Human genomics. The Genotype-Tissue Expression (GTEx) pilot analysis: multitissue gene regulation in humans. Science 348, 648–660 (2015). - PMC - PubMed
    1. Licatalosi D. D. & Darnell R. B. Splicing regulation in neurologic disease. Neuron 52, 93–101 (2006). - PubMed
    1. Raj B. & Blencowe B. J. Alternative splicing in the mammalian nervous system: recent insights into mechanisms and functional roles. Neuron 87, 14–27 (2015). - PubMed

Publication types

MeSH terms