. 2017 Feb 27:7:43217.
doi: 10.1038/srep43217.

Low-Cost Optical Mapping Systems for Panoramic Imaging of Complex Arrhythmias and Drug-Action in Translational Heart Models

Affiliations

Low-Cost Optical Mapping Systems for Panoramic Imaging of Complex Arrhythmias and Drug-Action in Translational Heart Models

Peter Lee et al. Sci Rep. .

Abstract

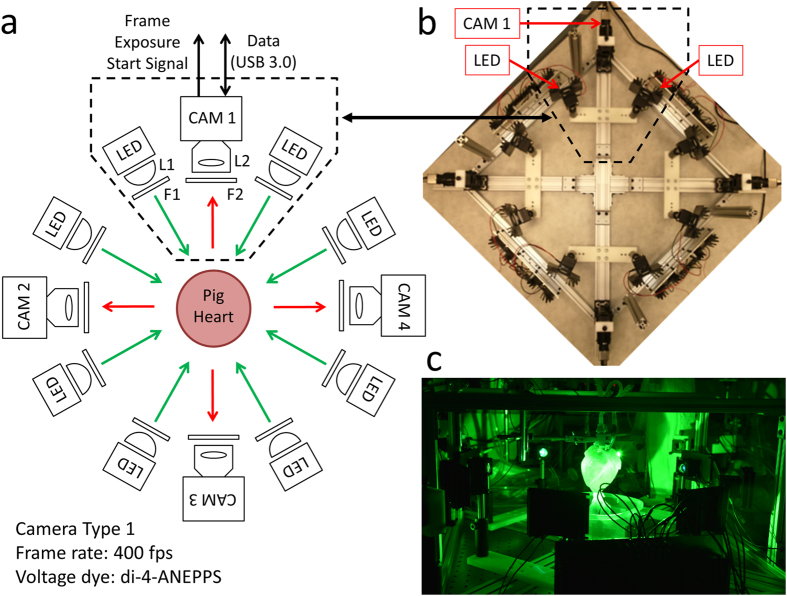
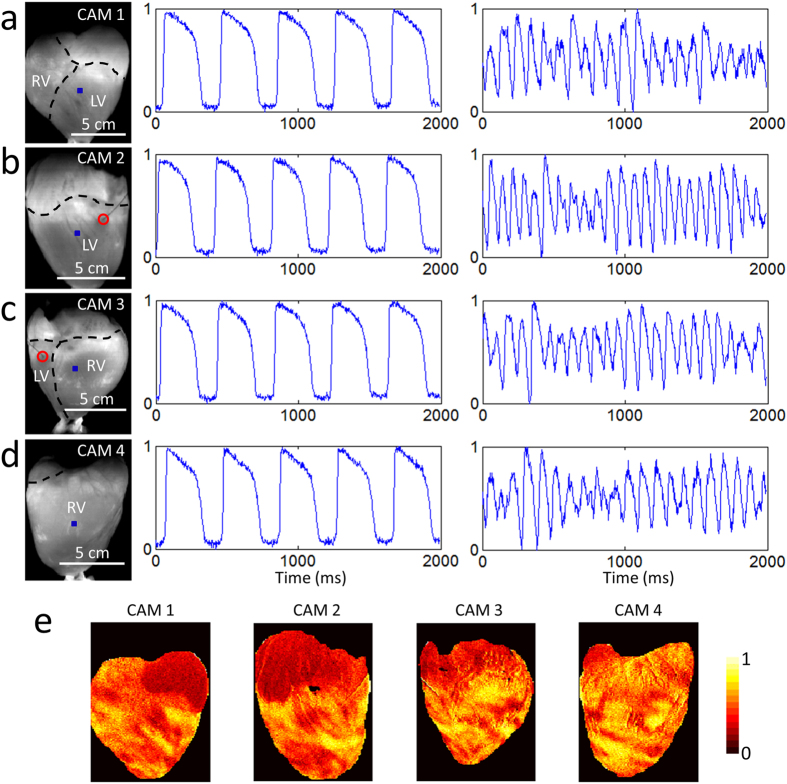
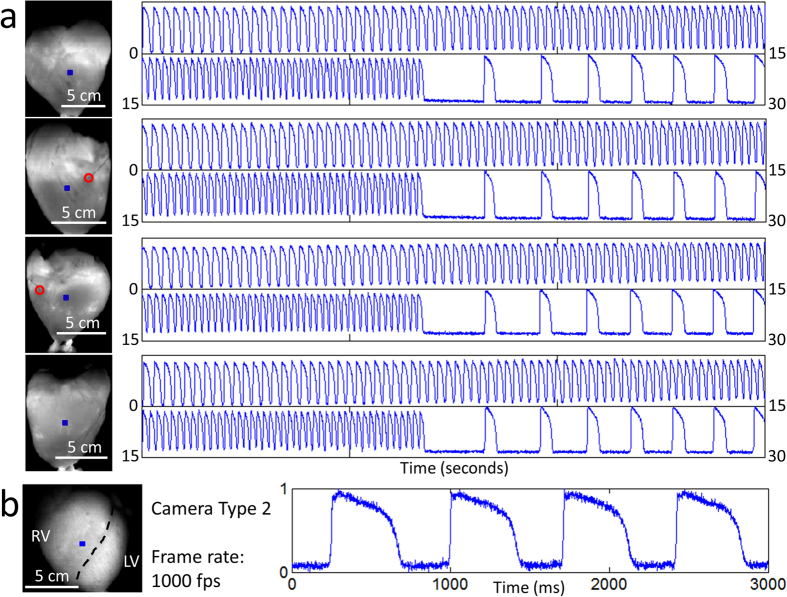
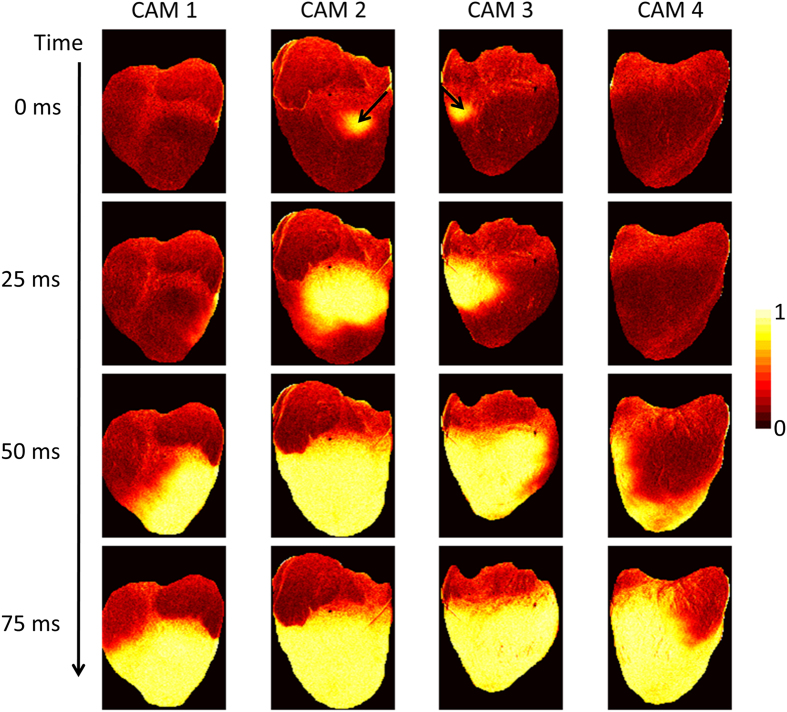
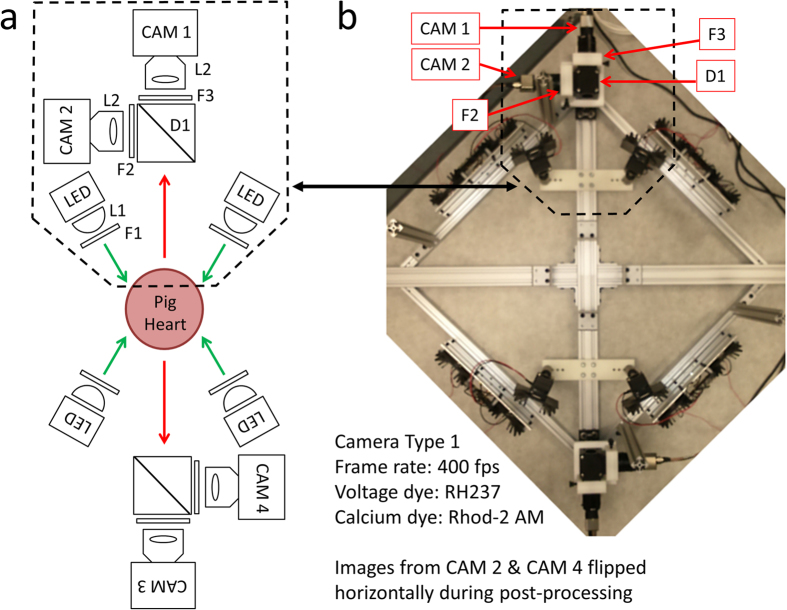
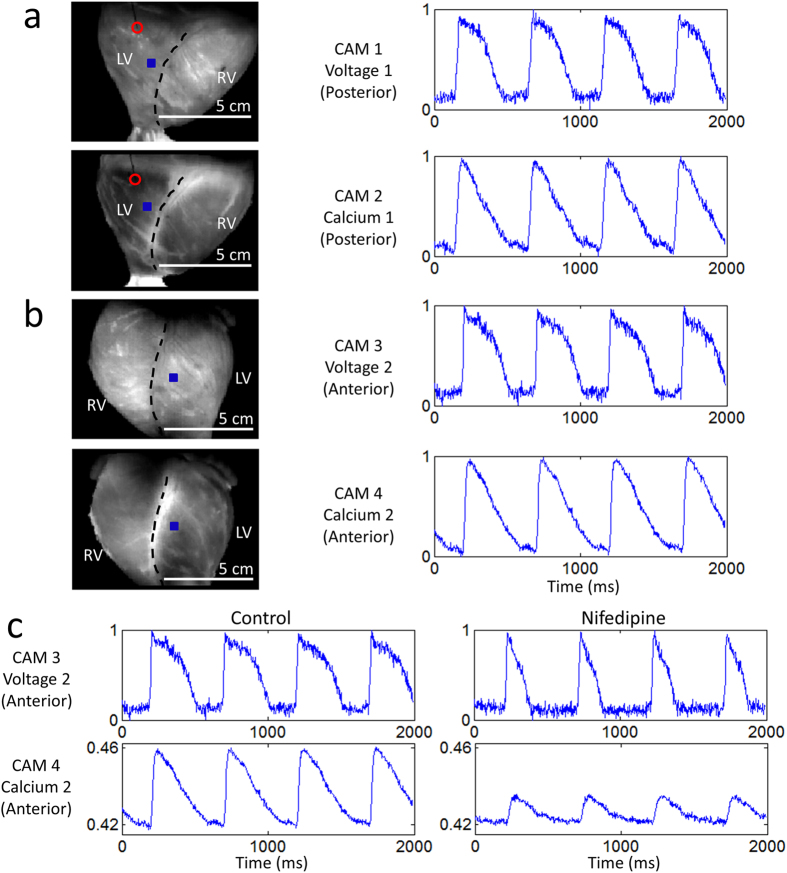
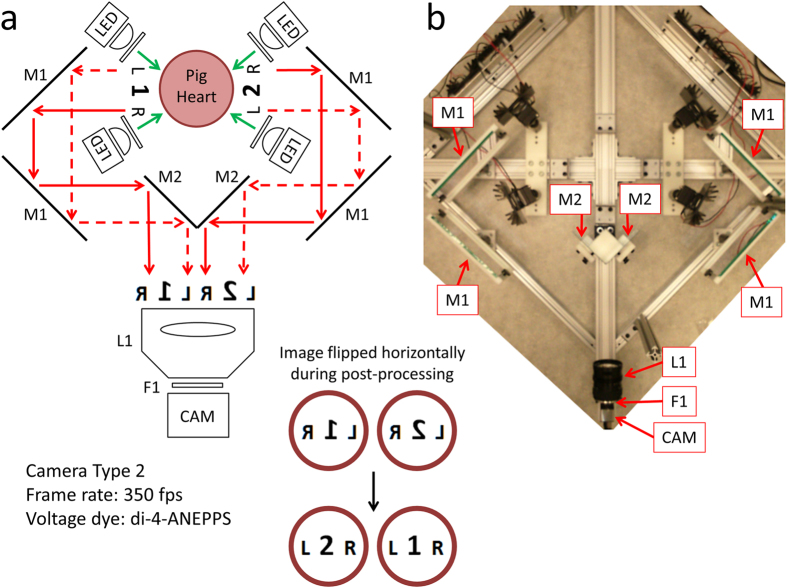
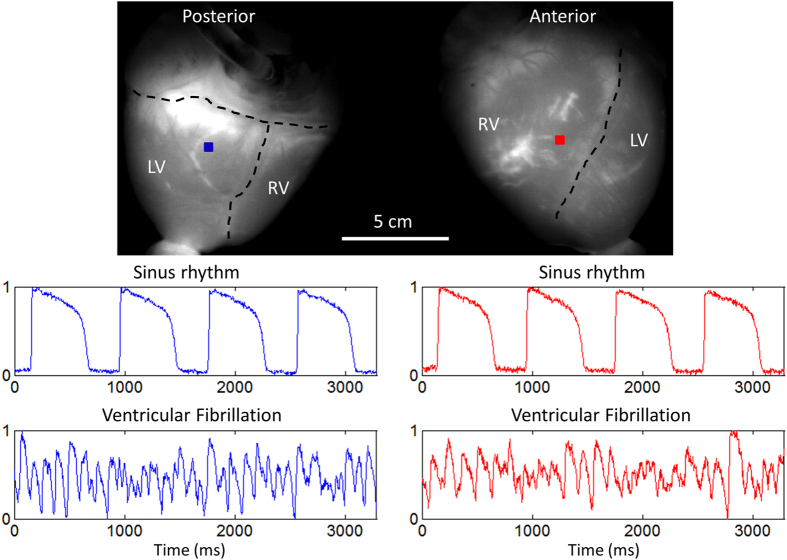
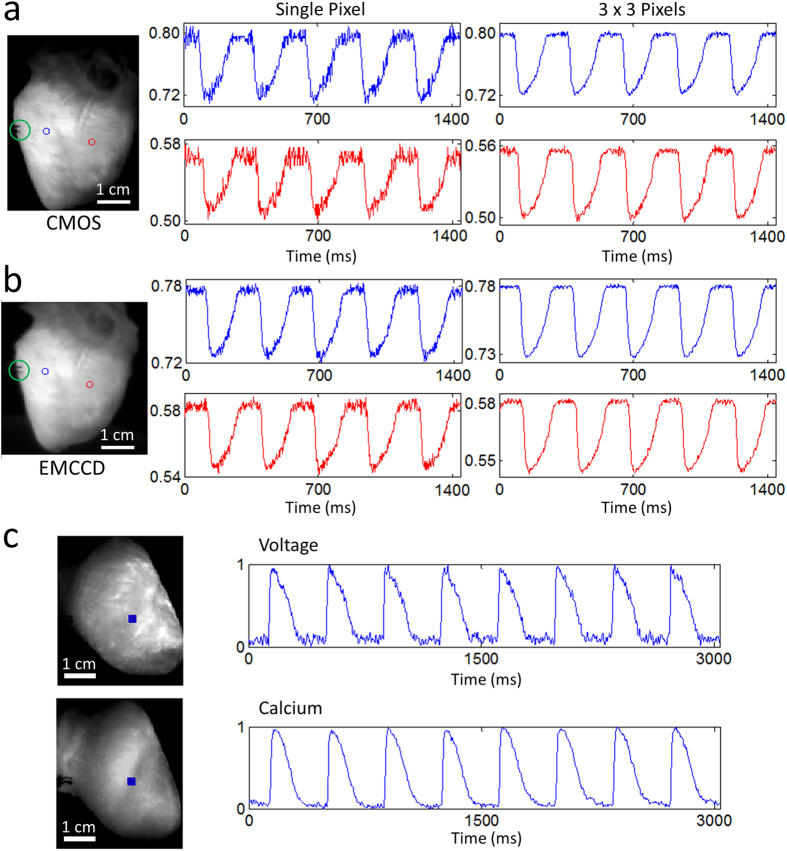
Panoramic optical mapping is the primary method for imaging electrophysiological activity from the entire outer surface of Langendorff-perfused hearts. To date, it is the only method of simultaneously measuring multiple key electrophysiological parameters, such as transmembrane voltage and intracellular free calcium, at high spatial and temporal resolution. Despite the impact it has already had on the fields of cardiac arrhythmias and whole-heart computational modeling, present-day system designs precludes its adoption by the broader cardiovascular research community because of their high costs. Taking advantage of recent technological advances, we developed and validated low-cost optical mapping systems for panoramic imaging using Langendorff-perfused pig hearts, a clinically-relevant model in basic research and bioengineering. By significantly lowering financial thresholds, this powerful cardiac electrophysiology imaging modality may gain wider use in research and, even, teaching laboratories, which we substantiated using the lower-cost Langendorff-perfused rabbit heart model.


Conflict of interest statement

P.L. is both an owner and employee of Essel Research and Development Inc. The other authors declare no competing financial interests.

Figures

Figure 1
Figure 1. Optical Mapping System 1: Layout (Langendorff-Perfused Pig Heart).
(a) System schematic showing key components (see text for details). One camera and two LED light sources are used to image the heart from each point-of-view (green arrows: excitation light, red arrows: fluorescence emission light). (b) Bird’s-eye view of the imaging and illumination subsystems outlined in (a). (c) A picture of part of the system during an experimental run. The illuminated pig heart is visible at the center of the picture.
Figure 2
Figure 2. Optical Mapping System 1: Sample Data (Langendorff-Perfused Pig Heart).
Normalized fluorescence signals from the (a) anterior, (b) left lateral, (c) posterior and (d) right lateral points-of-view of the heart during electrical pacing (middle panel) and ventricular fibrillation (right panel), taken from the blue-square regions shown (left panel). In the left panels, the right ventricle, left ventricle and atria are demarcated by black dashed lines and the red circle indicates the location of electrical point stimulation. Each of the four cameras can be independently positioned and rotated to adjust and optimize the position of the heart in its field-of-view. The varying scale bars in the left panels reflects these adjustments. Signals are in arbitrary fluorescence units. (e) Normalized fluorescence intensity map (colorbar shown) at one time point during ventricular fibrillation.
Figure 3
Figure 3. Optical Mapping System 1: Long-Duration and 1 kHz Recordings (Langendorff-Perfused Pig Heart).
(a) Samples of long-duration recordings from the same heart shown in Fig. 2. The 30 second segments show normalized fluorescence signals from the blue-square regions (left panel) at increasing pacing frequency. At ~22 seconds, the pacing was stopped and the heart returned to sinus rhythm. In the left panels, the red circle indicates the location of electrical point stimulation. (b) Normalized fluorescence signals from the blue-square region (left panel) on the surface of another heart taken at higher spatial and temporal resolution. In the left panel, the black dashed line demarcates the right ventricle and left ventricle. Signals are in arbitrary fluorescence units.
Figure 4
Figure 4. Optical Mapping System 1: Propagation Image Sequences (Langendorff-Perfused Pig Heart).
Normalized fluorescence intensity maps (colorbar shown) at progressive time points during electrical pacing (400 ms cycle length). The black arrows indicate the location of electrical point stimulation.
Figure 5
Figure 5. Optical Mapping System 2: Layout (Langendorff-Perfused Pig Heart).
(a) System schematic showing key components (see text for details). Two cameras and two LED light sources are used to image the heart from each point-of-view (green arrows: excitation light, red arrows: fluorescence emission light). One of the two cameras (CAM 1/CAM 3) is used to image transmembrane voltage while the other (CAM 2/CAM 4) is used to image intracellular free calcium. (b) Bird’s-eye view of the imaging and illumination subsystems outlined in (a).
Figure 6
Figure 6. Optical Mapping System 2: Sample Data (Langendorff-Perfused Pig Heart).
Normalized fluorescence signals from the (a) posterior and (b) anterior points-of-view of the heart during electrical pacing, taken from the blue-square regions shown (left panel). In the left panels, the right ventricle and left ventricle are demarcated by black dashed lines and the red circle indicates the location of electrical point stimulation. The four cameras can be independently positioned and rotated to adjust and optimize the position of the heart in their respective fields-of-view. (c) Control signals and altered signals (after exposure to 2 μM nifedipine) from a region on the anterior surface of the heart during electrical pacing at 2 Hz (same as in (b)). The action potential duration shortened and the calcium transient amplitude decreased. Signals are in arbitrary fluorescence units.
Figure 7
Figure 7. Optical Mapping System 3: Layout (Langendorff-Perfused Pig Heart).
(a) System schematic showing key components (see text for details). One high resolution camera, six mirrors and four LED light sources are used to image the heart from the anterior and posterior points-of-view (green arrows: excitation light, red arrows: fluorescence emission light). (b) Bird’s-eye view of the imaging and illumination subsystems outlined in (a).
Figure 8
Figure 8. Optical Mapping System 3: Sample Data (Langendorff-Perfused Pig Heart).
Normalized fluorescence signals from the posterior and anterior points-of-view of the heart during sinus rhythm and ventricular fibrillation, taken from the blue-square and red-square regions shown, respectively. In the top panel, the right ventricle, left ventricle and atria are demarcated by black dashed lines. Signals are in arbitrary fluorescence units.
Figure 9
Figure 9. Sample Data from Langendorff-Perfused Rabbit Hearts.
Fluorescence signals from two points on the ventricles (left panel; centered on the red and blue circles) during electrical pacing (green circle indicates the location of electrical point stimulation) using the (a) CMOS camera and (b) EMCCD camera (see text for details). Single pixel and spatially averaged (3 × 3 pixels) traces are shown, unfiltered in time. The SNRs were considerably higher for the EMCCD camera. (c) Simultaneous voltage and calcium imaging traces (normalized) taken from the blue-square regions shown (left panel) during sinus rhythm. Signals are in arbitrary fluorescence units.

References

    1. Boukens B. J. & Efimov I. R. A century of optocardiography. IEEE Rev. Biomed. Eng. 7, 115–125 (2014). - PMC - PubMed
    1. Herron T. J., Lee P. & Jalife J. Optical imaging of voltage and calcium in cardiac cells & tissues. Circulation Research 110, 609–623 (2012). - PMC - PubMed
    1. Trayanova N. A. Whole-heart modeling : Applications to cardiac electrophysiology and electromechanics. Circulation Research 108, 113–128 (2011). - PMC - PubMed
    1. Lin S. F. & Wikswo J. P. Panoramic optical imaging of electrical propagation in isolated heart. J. Biomed. Opt. 4, 200–7 (1999). - PubMed
    1. Bray M. A., Lin S. F. & Wikswo J. P. Jr, Three-dimensional surface reconstruction and fluorescent visualization of cardiac activation. IEEE Trans. Biomed. Eng. 47, 1382–1391 (2000). - PubMed

Publication types