. 2017 Apr 3;127(4):1517-1530.
doi: 10.1172/JCI88896. Epub 2017 Feb 27.

Autocrine lysophosphatidic acid signaling activates β-catenin and promotes lung allograft fibrosis

Autocrine lysophosphatidic acid signaling activates β-catenin and promotes lung allograft fibrosis

Pengxiu Cao et al. J Clin Invest. .

Abstract

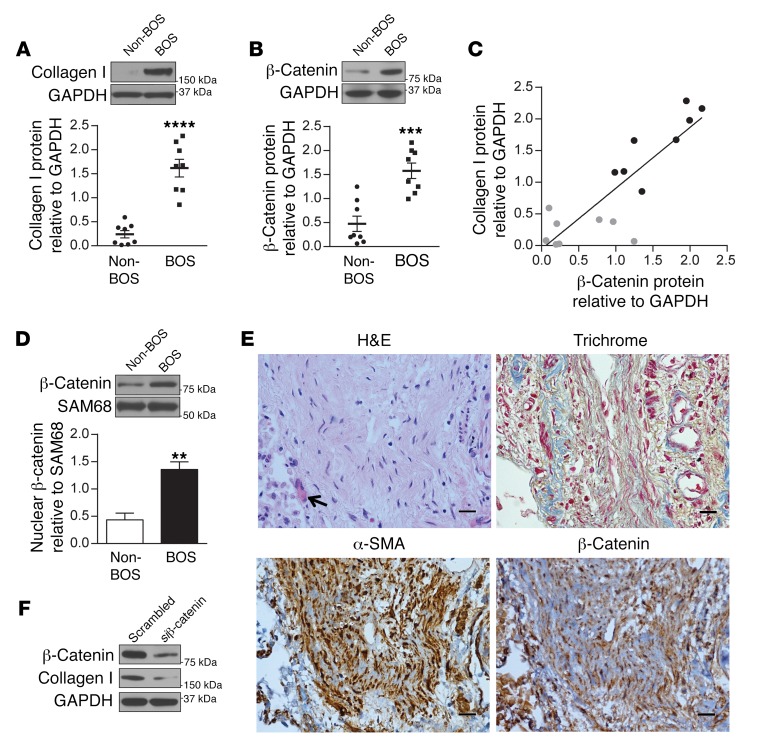
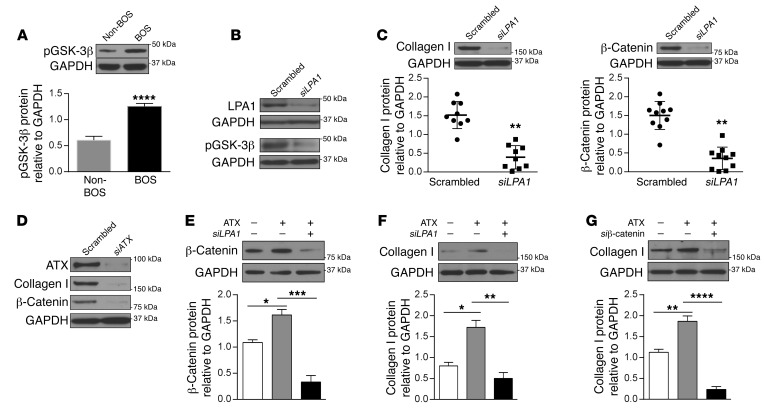
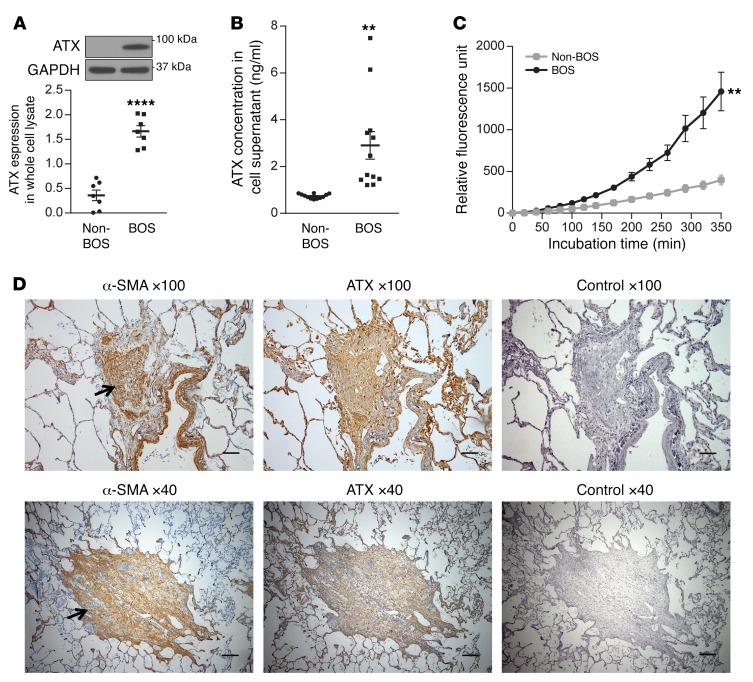
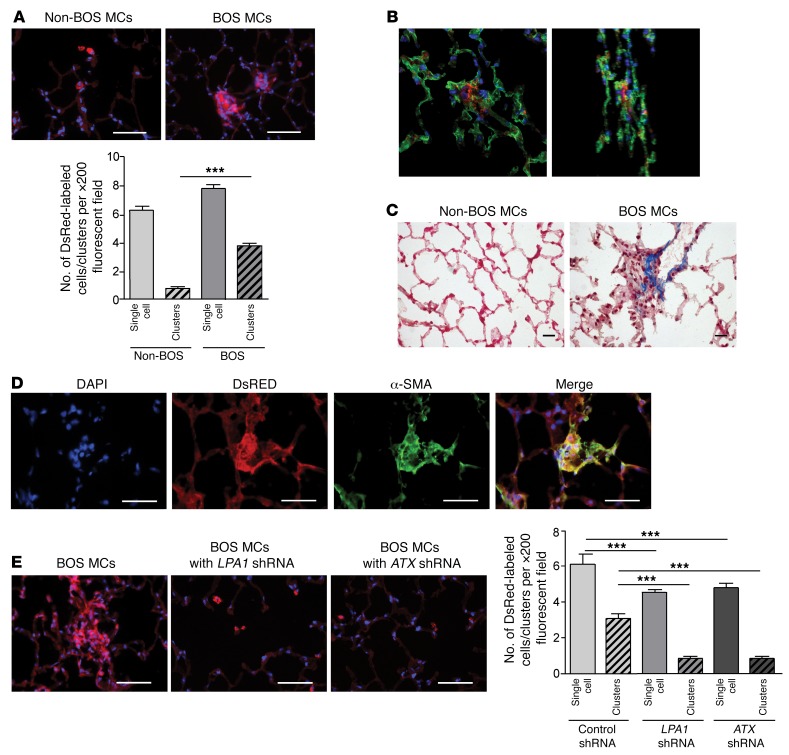
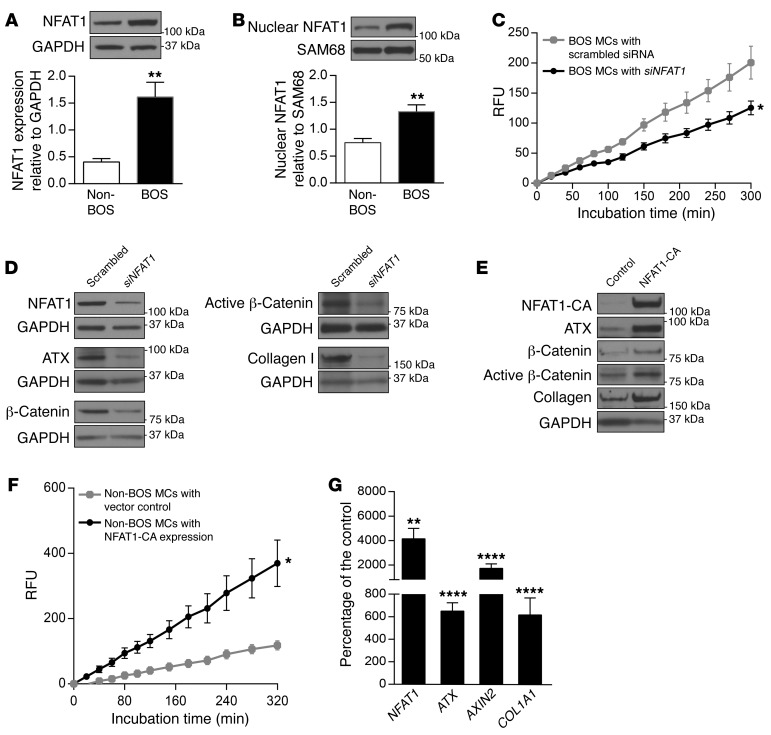
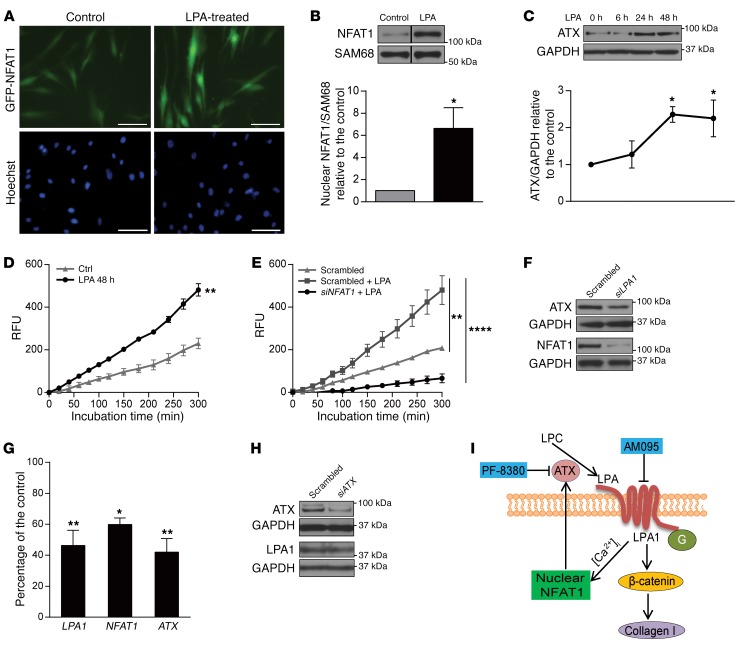
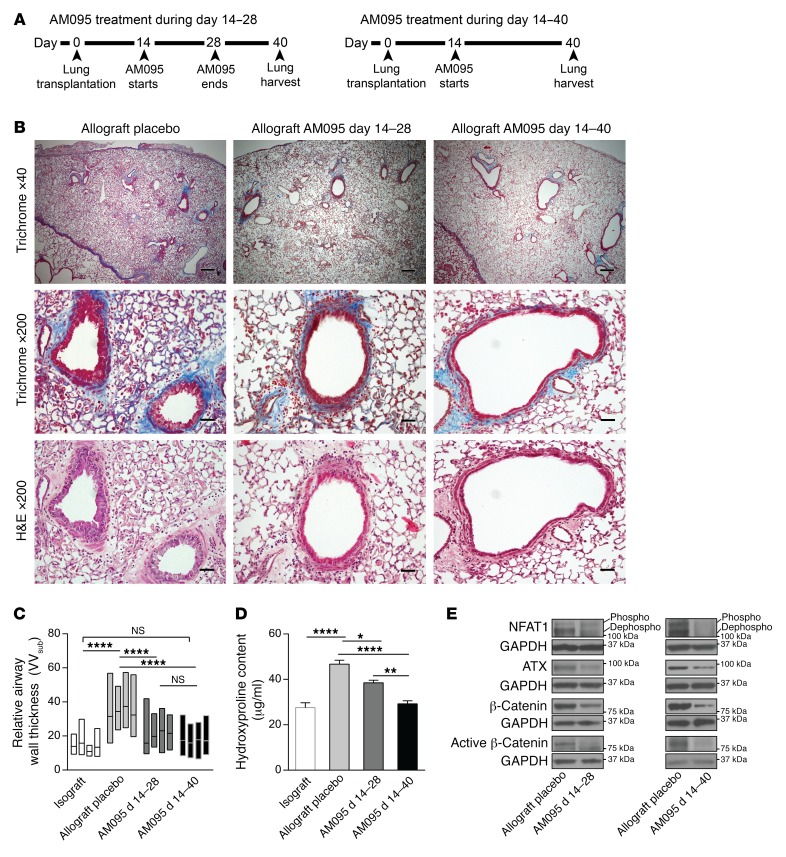
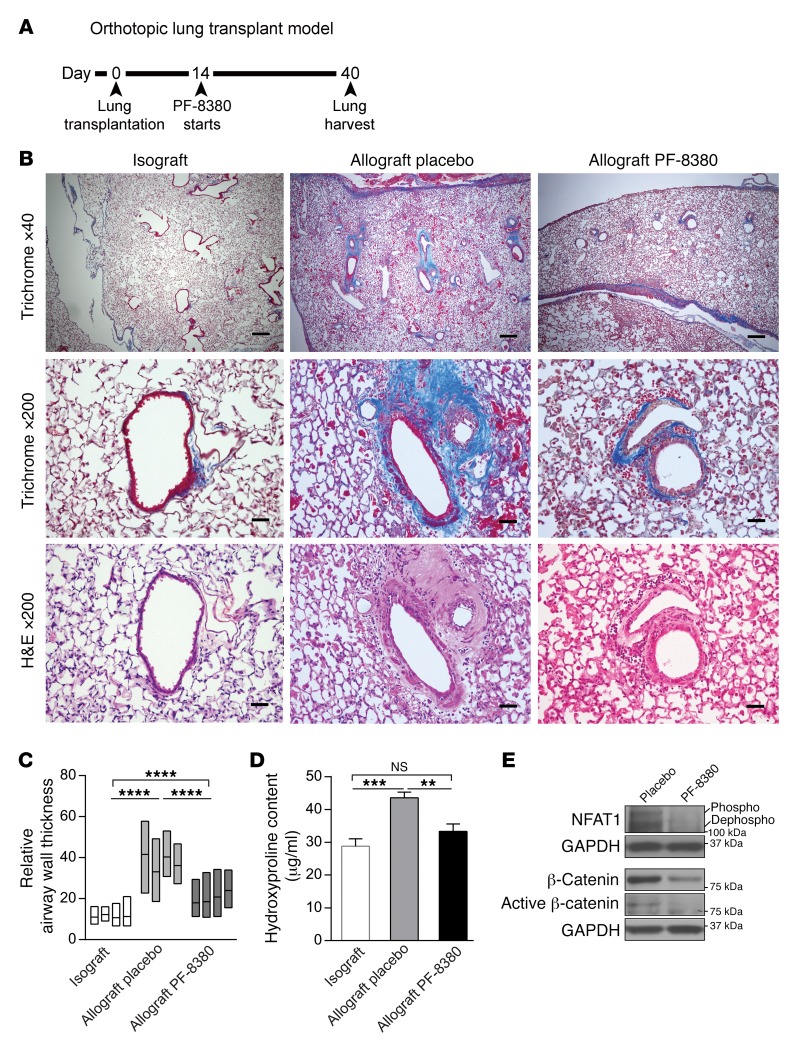
Tissue fibrosis is the primary cause of long-term graft failure after organ transplantation. In lung allografts, progressive terminal airway fibrosis leads to an irreversible decline in lung function termed bronchiolitis obliterans syndrome (BOS). Here, we have identified an autocrine pathway linking nuclear factor of activated T cells 2 (NFAT1), autotaxin (ATX), lysophosphatidic acid (LPA), and β-catenin that contributes to progression of fibrosis in lung allografts. Mesenchymal cells (MCs) derived from fibrotic lung allografts (BOS MCs) demonstrated constitutive nuclear β-catenin expression that was dependent on autocrine ATX secretion and LPA signaling. We found that NFAT1 upstream of ATX regulated expression of ATX as well as β-catenin. Silencing NFAT1 in BOS MCs suppressed ATX expression, and sustained overexpression of NFAT1 increased ATX expression and activity in non-fibrotic MCs. LPA signaling induced NFAT1 nuclear translocation, suggesting that autocrine LPA synthesis promotes NFAT1 transcriptional activation and ATX secretion in a positive feedback loop. In an in vivo mouse orthotopic lung transplant model of BOS, antagonism of the LPA receptor (LPA1) or ATX inhibition decreased allograft fibrosis and was associated with lower active β-catenin and dephosphorylated NFAT1 expression. Lung allografts from β-catenin reporter mice demonstrated reduced β-catenin transcriptional activation in the presence of LPA1 antagonist, confirming an in vivo role for LPA signaling in β-catenin activation.


Conflict of interest statement

Conflict of interest: The authors have declared that no conflict of interest exists.

Figures

Figure 1
Figure 1. Increased MC β-catenin expression in fibrotic human lung allografts.
(A and B) Collagen I and β-catenin protein levels in MCs derived from lung allografts with and without BOS were analyzed by immunoblotting. Mean ± SEM (n = 8/group). P values were obtained by unpaired t test. The collagen I antibody recognizes both chains of α1 and α2. (C) Correlation of total β-catenin and collagen I protein expression in individual patient-derived MCs is shown (P < 0.0001 determined by 2-tailed test; r2 = 0.7310 obtained by correlation). Non-BOS MCs (gray dots, n = 8), BOS MCs (black dots, n = 8). (D) Nuclear fraction of β-catenin in BOS and non-BOS MCs was measured by immunoblotting. Mean ± SEM (n = 5/group) with unpaired t test. (E) Representative images of β-catenin and α-SMA immunohistochemical staining of histological sections demonstrating BO. H&E and trichrome staining demonstrate a tangentially cut, completely obliterated bronchus. Myofibroblasts in the fibrous plug in the lumen of the bronchus are recognized by positive α-SMA immunohistochemical staining (brown DAB). Overlapping of β-catenin staining with hematoxylin blue nuclear stains was noted in these MCs. Scale bars: 20 μm. (F) Expression of β-catenin contributes to fibrotic functions of BOS MCs. BOS MCs were transfected with β-catenin siRNA or scrambled siRNA, and protein expression was measured by immunoblotting (n = 5/group). **P < 0.01, ***P < 0.001, ****P < 0.0001.
Figure 2
Figure 2. Function of the ATX/LPA/LPA1 signaling axis in β-catenin stabilization and collagen I induction in MCs.
(A) Phospho–GSK-3β (Ser9) protein expression in BOS and non-BOS MCs as measured by immunoblotting. Mean ± SEM (n = 5 for non-BOS MCs and 6 for BOS MCs with unpaired t test). (B and C) BOS MCs were transfected with LPA1 siRNA or scrambled siRNA and analyzed by immunoblotting. Representative immunoblots shown are from the same biological sample. Blots of collagen I and β-catenin from one membrane and hence the same loading control (GAPDH) blot are shown. Quantitative analysis demonstrates the effect of LPA1 silencing on collagen I (n = 9) and β-catenin (n = 10) protein expression in MCs derived from individual patients with BOS (mean ± SEM, paired t test). (D) BOS MCs were transfected with siATX or scrambled siRNA, and protein expression was analyzed by immunoblotting (n = 4). (EG) Non-BOS MCs were treated with recombinant ATX (100 ng/ml, 24 hours). In the indicated conditions, cells were transfected with LPA1 or β-catenin siRNA before ATX treatment. Mean ± SEM (n = 5/group for E and F, and n = 4/group for G with ANOVA). Data were similar in 3 independent experiments. *P < 0.05, **P < 0.01, ***P < 0.001, ****P < 0.0001.
Figure 3
Figure 3. Increased ATX expression and activity in BOS MCs.
(A) Basal ATX expression in BOS and non-BOS MCs was measured by immunoblotting in whole cell lysates. Mean ± SEM (n = 7/group) with unpaired t test. (B) ATX expression in cell supernatant (24-hour collection) was quantitated by ELISA. Mean ± SEM (n = 12/group) with unpaired t test. (C) Cell supernatant collected after 72 hours of incubation from BOS and non-BOS MCs was concentrated, and ATX activity was assayed using the fluorogenic phospholipid ATX substrate FS-3 (n = 4 for BOS MCs and 5 for non-BOS MCs with ANOVA). Data were repeated in 3 independent experiments. Mean ± SEM. **P < 0.01, ****P < 0.0001. (D). Serial sections from lung allografts of patients with BOS collected at autopsy were analyzed by immunohistochemistry for ATX or α-SMA and counterstained with hematoxylin. Two separate areas with completely obliterated airways are shown in the top and bottom panels. Arrows indicated the obliterated bronchi. Scale bars: 80 μm for ×100 images and 200 μm for ×40 images.
Figure 4
Figure 4. In vivo fibrotic behavior of human BOS MCs after adoptive transfer demonstrates dependence on intact ATX/LPA1 signaling.
(A) BOS MCs establish fibrotic lesions in vivo after adaptive transfer. MCs obtained from normal and fibrotic human lung allograft (non-BOS MCs and BOS MCs) were infected with DsRed lentivirus and adoptively transferred via intratracheal administration into lungs of immunodeficient (Beige/Nude/XID) mice. Lungs were harvested on day 45 after administration of cells and stained with DAPI. Lower panel shows quantitative analysis of single cells or cell clusters (>3 adjacent cells) of human MCs in murine lung sections. Nucleated red fluorescent cells were quantitated under ×200 magnification in 12 fields per slide. Mean ± SEM with ANOVA (n = 4 for non-BOS MCs and 10 for BOS MCs). Scale bars: 50 μm. (B) Confocal microscopy demonstrating interstitial localization of human BOS MCs engrafted in immunodeficient mouse lungs. Epithelia were stained green by cytokeratin immunofluorescence staining (MAB3412, Millipore). Images of z-projections from two different rotation angles are shown. (C) Trichrome staining images of immunodeficient mouse lungs intratracheally transferred with non-BOS or BOS MCs. Scale bars: 20 μm. (D) Characterization of fibrotic lesions induced by adoptive transfer of BOS MCs into immunodeficient mouse lungs. Positive immunofluorescence staining with α-SMA antibody (M0851, Dako) was noted in DsRed fluorescent human BOS MC clusters. Scale bars: 50 μm. (E) Endogenous LPA synthesis and signaling are requisite for establishing fibrotic lesions of BO MCs after adoptive transfer. DsRed-labeled BOS MCs were infected with lentivirus containing the silencing control vector, LPA1 shRNA, or ATX shRNA and then were adoptively transferred into immunodeficient mice. BOS MCs infected with LPA1 or ATX shRNA–expressing lentivirus failed to form fibrotic lesions. Right panel shows quantitative analysis. Mean ± SEM (n = 3/group with ANOVA). Scale bars: 50 μm. ***P < 0.001.
Figure 5
Figure 5. NFAT1 regulates ATX, β-catenin, and collagen I expression in lung MCs.
(A and B) Expression of NFAT1 protein in whole cell lysate (n = 4/group) and nuclear extract (n = 5–6/group) in BOS and non-BOS MCs measured by immunoblotting with unpaired t test. (C) ATX activity was measured in concentrated cell supernatant from BOS MCs transfected with NFAT1-specific or scrambled siRNA (n = 4/group with 2-way ANOVA). (D) BOS MCs were transfected with siRNAs for NFAT1 or scrambled control, and protein expression of ATX, β-catenin, active β-catenin, and collagen I was analyzed by immunoblotting (n = 7/group). (E) Non-BOS MCs were infected with lentivirus expressing pLentilox-NFAT1-CA-IRES-Puro plasmid or DsRed-expressing vector control, and the indicated protein levels were examined in parallel gels (n = 6/group). NFAT1-CA, constitutively active NFAT1. (F) ATX activity in the cell supernatant from non-BOS MCs infected with lentivirus expressing NFAT1-CA was assayed (n = 3/group with 2-way ANOVA). (G) NFAT1, ATX, AXIN2, and COL1A1 mRNA levels were assayed by real-time PCR in non-BOS MCs infected with lentivirus expressing NFAT1-CA. Mean ± SEM (n = 7–8/group) with paired t test. Experiments were repeated 3 times; *P < 0.05, **P < 0.01, ****P < 0.0001.
Figure 6
Figure 6. Autocrine loop of NFAT1 and ATX regulation by LPA.
(A) Representative live cell imaging of non-BOS MCs expressing GFP-NFAT1 in the presence or absence of LPA (10 μM, 1 hour) (n = 5/group). Scale bars: 100 μm. (B) Non-BOS MCs were treated with LPA, and NFAT1 expression in nuclear extract was analyzed by immunoblotting. Lanes were run on the same gel but were noncontiguous, as indicated by the black lines. Mean ± SEM (n = 4/group with paired t test). (C) ATX expression in whole cell lysates of non-BOS MCs treated with LPA (10 μM) for varying time intervals. Mean ± SEM (n = 4/group with 1-way ANOVA). (D) ATX activity as measured in concentrated conditioned medium from non-BOS MCs cultured in the presence or absence (Ctrl) of LPA (n = 3/group with 2-way ANOVA). (E) Non-BOS MCs were transfected with NFAT1 siRNA or scrambled siRNA and treated with LPA for 48 hours (10 μM). The ATX activity in concentrated cell supernatant is shown (n = 9/group with 2-way ANOVA). The results represent mean ± SEM from 2 independent experiments. (F) NFAT1 and ATX protein expression was analyzed by immunoblotting in BOS MCs transfected with siRNAs for LPA1 or scrambled control (n = 5/group). (G) LPA1, NFAT1, and ATX mRNA expression was assayed by real-time PCR in BOS MCs transfected with LPA1 siRNA or scrambled control siRNA. Mean ± SEM (n = 3–6/group with paired t test). Experiments were performed twice. (H) ATX and LPA1 expression in MCs transfected with siATX was assayed by immunoblotting with scrambled siRNA transfected MCs as control. Mean ± SEM (n = 8/group with paired t test). *P < 0.05, **P < 0.01, ****P < 0.0001. (I) Schematic model of the proposed pathway by which autocrine LPA production regulates MC activation. G, G proteins; AM095, LPA1 inhibitor; PF-8380, ATX inhibitor.
Figure 7
Figure 7. LPA1 antagonist AM095 treatment decreases lung allograft fibrosis in murine orthotopic lung transplant model.
(A) Time line of two durations of AM095 treatment. (B) Decreased airway remodeling and fibrosis in allografts treated with AM095 by trichrome and H&E staining. Lung allografts were treated with AM095 during days 14–28 or days 14–40, both harvested on day 40 after transplantation (n = 5 for placebo, 4 for AM095 treatment during days 14–28, and 5 for AM095-treated allografts during days 14–40). An Olympus BX41 microscope with an Olympus DP20 camera was used to take images. Scale bars: 200 μm for ×40 images and 40 μm for ×200 images. (C) Morphometric analysis of airway wall thickness in transplanted placebo allografts, AM095-treated allografts for days 14–28, and AM095-treated allografts for days 14–40 (n = 4/group with ANOVA). Data are represented by floating bars ranging from minimum to maximum, with a line showing the mean value of each graft. (D) Hydroxyproline assay in lung grafts was conducted for collagen content quantitation. Both durations of AM095 treatment significantly reduced hydroxyproline content in allografts (n = 7 for isograft and 6 for the rest of the groups, with ANOVA). *P < 0.05, **P < 0.01, ****P < 0.0001. (E) Dephosphorylated (dephospho) NFAT1, ATX, and total and active β-catenin proteins was decreased in allografts treated with AM095 (n = 4/group) by immunoblot.
Figure 8
Figure 8. PF-8380 attenuates lung allograft fibrosis and BO development in murine orthotopic lung transplant model.
(A) Time line of murine orthotopic lung transplantation and administration of the ATX inhibitor PF-8380. (B) Trichrome and H&E staining of lung grafts harvested on day 40 after transplantation demonstrated decreased airway remodeling and fibrosis in allografts treated with PF-8380 (n = 3 for isograft, 5 for placebo- and PF-8380–treated allograft). Images were taken by an Olympus BX41 microscope with an Olympus DP20 camera. Scale bars: 200 μm for ×40 images and 40 μm for ×200 images. (C) Morphometric analysis of airway wall thickness in transplanted lung isografts, placebo allografts, and PF-8380–treated allografts (n = 4/group with ANOVA). Data for each graft are represented as a floating bar ranging from minimum to maximum, with a line showing the mean value. Data for isografts and allograft placebos were obtained by measuring from different slides of the same animal groups as in Figure 7C. (D) Collagen content quantitation by hydroxyproline assay in lung grafts. PF-8380 treatment significantly reduced hydroxyproline content in allografts (n = 7 for isograft and 6 for the rest of the groups, with ANOVA). Samples for isograft and allograft placebo were from the same corresponding groups as in Figure 7D and were measured again together with PF-8380–treated allografts. **P < 0.01, ***P < 0.001, ****P < 0.0001. (E) Western blot analysis demonstrated decreased expression of dephosphorylated NFAT1 and total and active β-catenin proteins in allografts treated with PF-8380 (n = 4/group). All representative blots shown were from the same biological samples. Total and active β-catenin were blotted simultaneously on 2 parallel gels.
Figure 9
Figure 9. LPA contributes to nuclear transcriptional activity of β-catenin in vivo during allograft fibrogenesis.
Axin2lacZ mice were utilized as donors in the orthotopic lung transplant model. Transplanted mice were treated with AM095 or placebo during days 14–40 after transplantation. β-Galactosidase, trichrome, and H&E staining was performed on isografts and placebo- and AM095-treated allografts harvested at day 40 (n = 2 for isograft, n = 3 for groups of placebo- and AM095-treated allografts). Images were taken with a Nikon Eclipse E600 microscope equipped with a Cool Snap EZ camera and NIS-Elements BR3.2 software. Strong (purple) β-galactosidase staining with Salmon-gal was noted in bronchial subepithelial MCs in allografts. β-Galactosidase staining was markedly diminished in allografts treated with AM095. Scale bars: 30 μm.

References

    1. Estenne M, et al. Bronchiolitis obliterans syndrome 2001: an update of the diagnostic criteria. J Heart Lung Transplant. 2002;21(3):297–310. doi: 10.1016/S1053-2498(02)00398-4. - DOI - PubMed
    1. Lama VN, et al. Evidence for tissue-resident mesenchymal stem cells in human adult lung from studies of transplanted allografts. J Clin Invest. 2007;117(4):989–996. doi: 10.1172/JCI29713. - DOI - PMC - PubMed
    1. Badri L, et al. Mesenchymal stromal cells in bronchoalveolar lavage as predictors of bronchiolitis obliterans syndrome. Am J Respir Crit Care Med. 2011;183(8):1062–1070. doi: 10.1164/rccm.201005-0742OC. - DOI - PMC - PubMed
    1. Walker N, et al. Resident tissue-specific mesenchymal progenitor cells contribute to fibrogenesis in human lung allografts. Am J Pathol. 2011;178(6):2461–2469. doi: 10.1016/j.ajpath.2011.01.058. - DOI - PMC - PubMed
    1. Li Y, et al. Severe lung fibrosis requires an invasive fibroblast phenotype regulated by hyaluronan and CD44. J Exp Med. 2011;208(7):1459–1471. doi: 10.1084/jem.20102510. - DOI - PMC - PubMed

MeSH terms