. 2017 Feb 27;13(2):e1006623.
doi: 10.1371/journal.pgen.1006623. eCollection 2017 Feb.

Differential Sensitivity of Target Genes to Translational Repression by miR-17~92

Affiliations

Differential Sensitivity of Target Genes to Translational Repression by miR-17~92

Hyun Yong Jin et al. PLoS Genet. .

Abstract

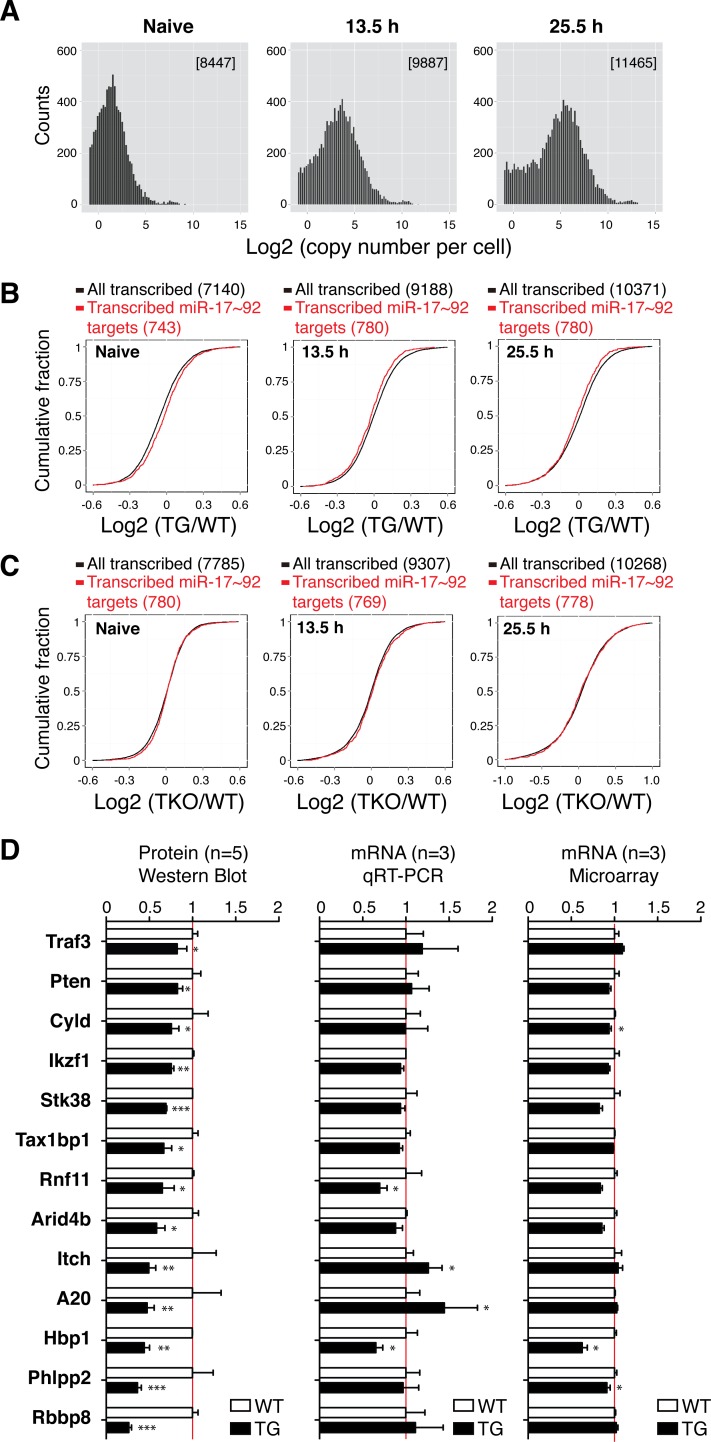
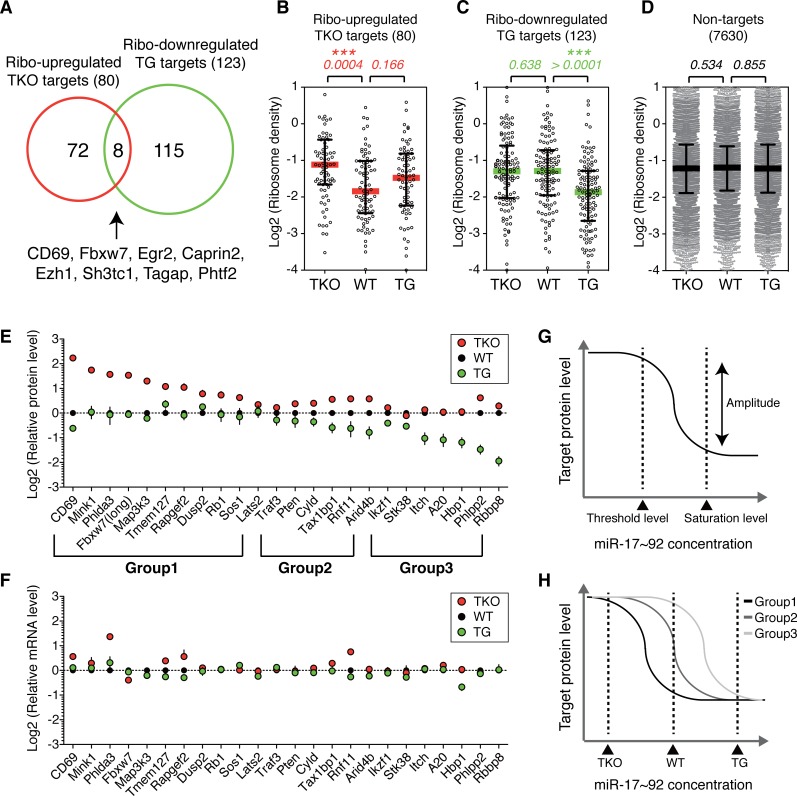
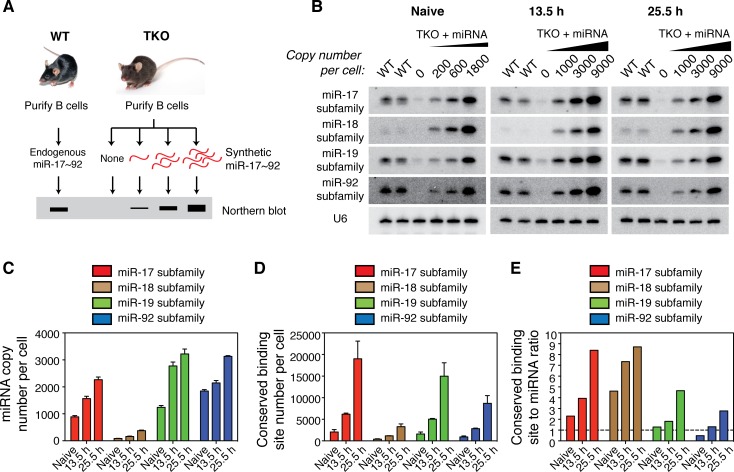
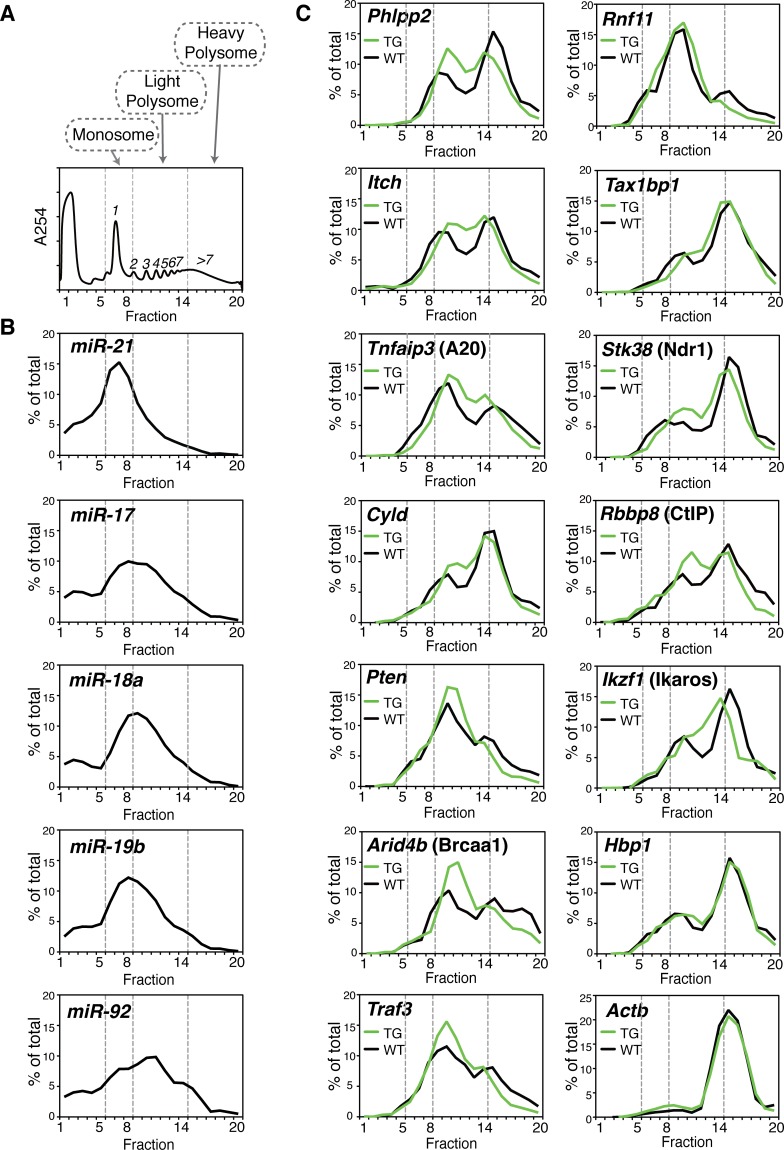
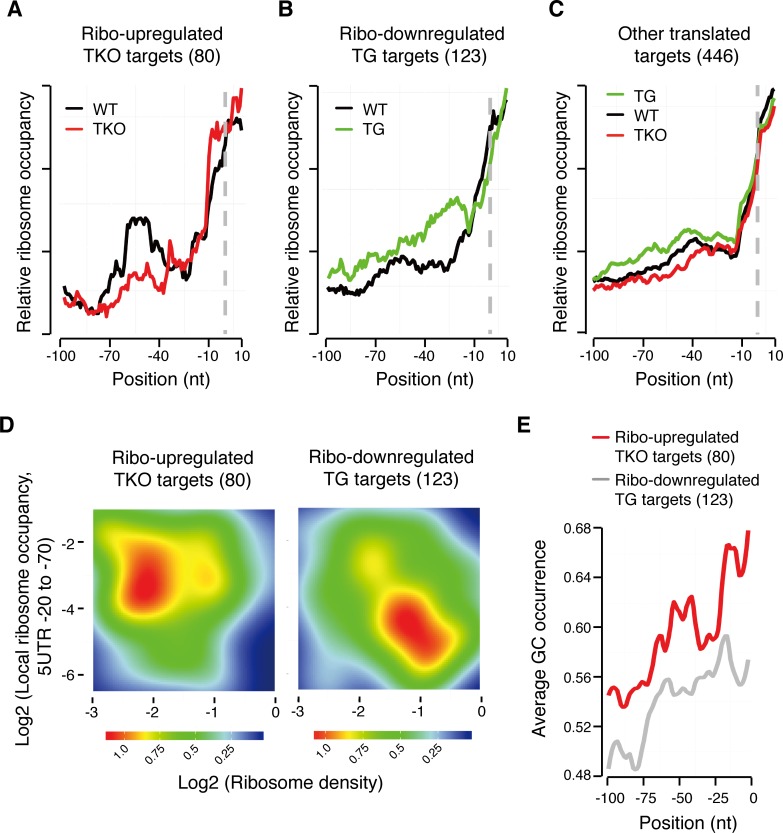
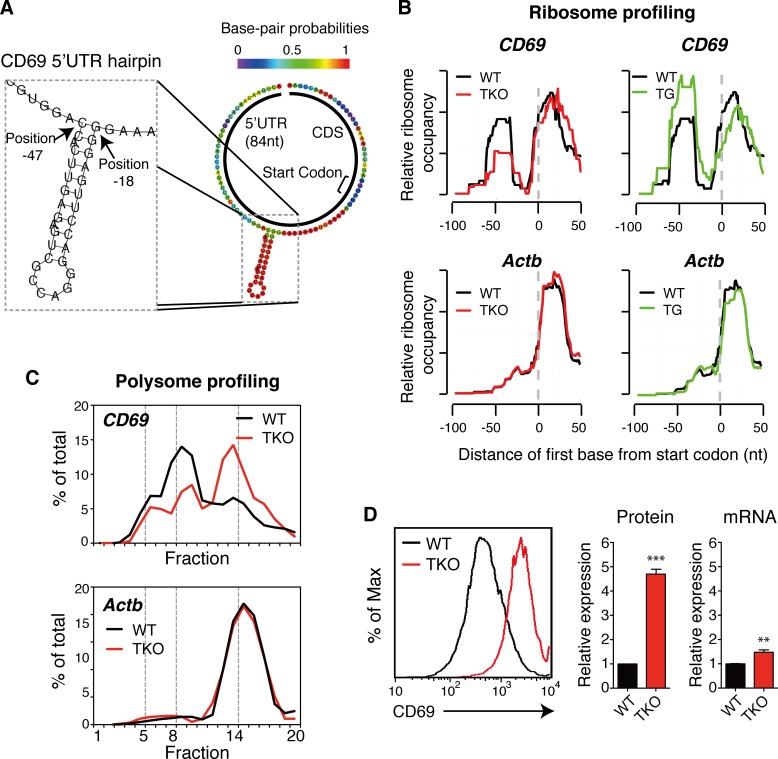
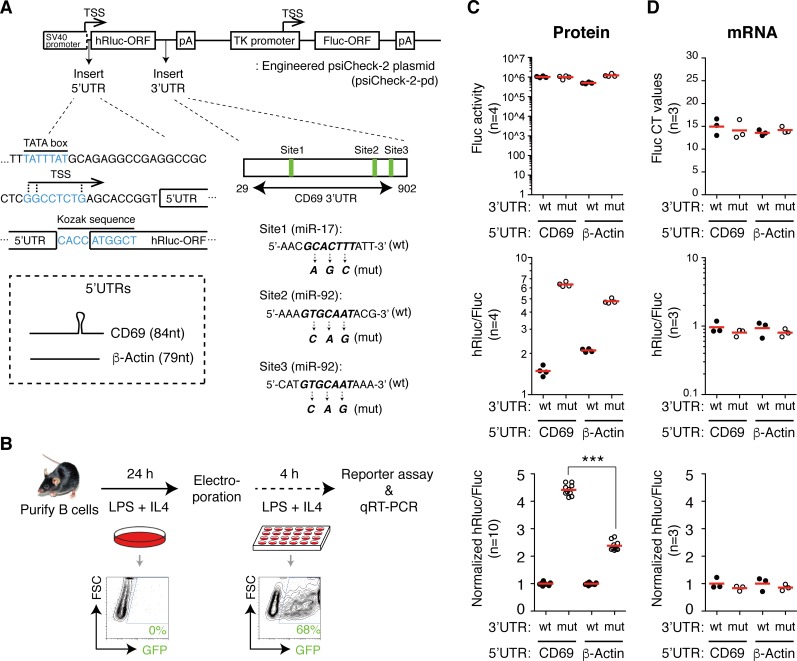
MicroRNAs (miRNAs) are thought to exert their functions by modulating the expression of hundreds of target genes and each to a small degree, but it remains unclear how small changes in hundreds of target genes are translated into the specific function of a miRNA. Here, we conducted an integrated analysis of transcriptome and translatome of primary B cells from mutant mice expressing miR-17~92 at three different levels to address this issue. We found that target genes exhibit differential sensitivity to miRNA suppression and that only a small fraction of target genes are actually suppressed by a given concentration of miRNA under physiological conditions. Transgenic expression and deletion of the same miRNA gene regulate largely distinct sets of target genes. miR-17~92 controls target gene expression mainly through translational repression and 5'UTR plays an important role in regulating target gene sensitivity to miRNA suppression. These findings provide molecular insights into a model in which miRNAs exert their specific functions through a small number of key target genes.


Conflict of interest statement

The authors have declared that no competing interests exist.

Figures

Fig 1
Fig 1. The impact of miR-17~92 on target gene mRNA and protein levels.
(A) The distribution of mRNA abundance in naïve and activated B cells as determined by ERCC-RNA-seq analysis. Numbers in parenthesis represent the number of unique genes significantly transcribed (greater than 0.5 copy per cell). Y-axis (counts) indicates the number of genes of a given abundance (X-axis, bin size = 0.2). (B,C) Microarray analysis of TKO, WT, and TG B cells. Numbers in parenthesis indicate the numbers of transcribed genes and transcribed miR-17~92 targets analyzed by microarray. (D) The protein and mRNA levels of 13 target genes showing reduced protein levels in 25.5h activated TG B cells as determined by Immunoblot (n = 5). mRNA levels were determined by qRT-PCR and microarray (n = 3). Target gene expression levels were normalized to β-Actin, and their relative expression in WT naïve B cells was arbitrarily set as 1.0.
Fig 2
Fig 2. Target genes exhibit different sensitivity to miR-17~92 expression level changes.
(A) Minimal overlap between ribo-upregulated TKO targets and ribo-downregulated TG targets. (B-D) The responses of ribosome density of ribo-upregulated TKO targets (B) and ribo-downregulated TG targets (C) to three miR-17~92 expression levels. Translated genes lacking miR-17~92 binding sites were used as control (D). Colored bars indicate median values and error bars represent interquartile ranges. Each dot represents relative ribosome density of a unique gene. Numbers indicate p-values. (E) Different sensitivity of individual target genes to miR-17~92 expression level changes. Protein levels were determined by immunoblot and normalized to β-Actin (S7 and S11 Figs). Target gene protein levels in WT B cells were arbitrarily set as 1.0 (n≥4). Vertical lines indicate error bars. (F) Relative mRNA levels of individual target genes in TKO, WT and TG B cells as determined by microarray (n = 3). (G) A hypothetical curve depicting target gene protein level change as a function of miRNA concentration. For a miRNA-target mRNA interaction in a given cellular context, there are a threshold level and a saturation level of miRNA concentration. miRNA suppresses target gene expression in a dose-dependent manner when miRNA concentration is between the threshold and saturation levels. Suppression does not occur when miRNA concentration is below the threshold level, while suppression reaches a maximal when miRNA concentration is above the saturation level. (H) The hypothetical response curves of group1, group2 and group3 target genes to miR-17~92 expression level changes. Note that the difference in amplitude for individual target genes is not depicted in this graph.
Fig 3
Fig 3. Quantification of miR-17~92 miRNAs and binding sites in primary B cells.
(A,B) Quantitative Northern blot to determine miR-17~92 miRNA copy numbers. Indicated amounts of synthetic miR-17, miR-18a, miR-19b and miR-92 were added to naïve and activated TKO B cells before RNA extraction. The copy numbers of each miRNA subfamily were determined by Northern blot comparing WT B cells and TKO B cells with graded amounts of spike-in synthetic miRNAs, using a mixture of probes corresponding to all members of a miRNA subfamily (also see S7 Table). Naïve B cells were activated with LPS and IL-4 for indicated amounts of time (h, hour). (C-E) Summary of miR-17~92 family miRNA copy numbers (C), conserved miR-17~92 family miRNA binding sites (D) (also see S8 Table), and ratios of conserved miR-17~92 family miRNA binding sites to miRNAs (E) in naïve and activated B cells.
Fig 4
Fig 4. Transgenic miR-17~92 expression shifts target mRNAs from heavy to light polysomes.
(A) A representative polysome profile of activated B cells, from two biological replicates for each genotype. Numbers inside the graph indicate the number of ribosomes associated with mRNA. (B) Distribution of miR-21 and miR-17~92 in the sucrose gradient in WT B cells. (C) Distribution of miR-17~92 target mRNAs in the sucrose gradient in WT and TG B cells. β-Actin mRNA (Actb) is enriched in heavy polysome fractions and is used as an internal control.
Fig 5
Fig 5. Ribosome accumulation in 5’UTR correlates with translational repression of target genes.
(A-C) Ribosome accumulation in 5’UTRs of ribo-upregulated TKO targets in WT B cells (A), ribo-downregulated TG targets in TG B cells (B), but not in 5’UTRs of other targets (C). Ribosome occupancy in 5’UTR was normalized to the overall ribosome footprint abundance of the same gene [96]. The first nucleotide of start codon is set as position 0 (grey dashed line). (D) Inverse correlation between ribosome occupancy in 5’UTR and the overall ribosome density on target mRNA in WT B cells. (E) High GC content in 5’UTRs of ribo-upregulated TKO targets.
Fig 6
Fig 6. Secondary structures in 5’UTR correlate with translational repression of target genes.
(A) A hairpin structure in the CD69 5’UTR. (B) Ribosome accumulation in CD69 5’UTR correlated with miR-17~92 family miRNA expression levels. Note that the hairpin structure co-localizes with the ribosome footprint peak in the CD69 5’UTR. Actb was used as control. (C) Deletion of the miR-17~92 family miRNAs shifted CD69 mRNA from light to heavy polysomes. (D) Increased CD69 expression in TKO B cells was mainly due to translation de-repression. Experiments in B-D were performed with 25.5h activated B cells.
Fig 7
Fig 7. Regulation of target gene sensitivity to miRNA suppression by 5’UTR.
(A) An engineered psiCheck2 vector (psiCheck-2-pd) for investigating the effect of 5’UTR and 3’UTR on reporter gene expression. TSS, transcription start site. (B) Experimental scheme of reporter assays in primary B cells. FACS plots show electroporation efficiency using a GFP-expressing plasmid. (C,D) Dual luciferase reporter assay to determine the effect of 5’UTR and 3’UTR on the reporter gene protein (luciferase activity) (C) and mRNA (qRT-PCR) levels (D). Closed and open circles indicate reporters with wild-type (wt) and mutated (mut) CD69 3’UTR, respectively. A comparison of renilla luciferase activity normalized to firefly luciferase activity (hRluc/Fluc) between psiCheck-2-pd containing mut and wt CD69 3’UTR reveals the sensitivity of the renilla luciferase mRNA (hRluc) to miR-17~92-mediated suppression. Results of normalized hRlcu/Fluc (n = 10) are from three independent experiments. Each experiment contained 3–4 replicates.

Similar articles

Cited by

References

    1. Iwakawa HO, Tomari Y. The Functions of MicroRNAs: mRNA Decay and Translational Repression. Trends Cell Biol. 2015;25(11):651–65. Epub 2015/10/07. 10.1016/j.tcb.2015.07.011 - DOI - PubMed
    1. Jin HY, Xiao C. MicroRNA mechanisms of action: what have we learned from mice? Frontiers in Genetics. 2015;6:328 10.3389/fgene.2015.00328 - DOI - PMC - PubMed
    1. Jonas S, Izaurralde E. Towards a molecular understanding of microRNA-mediated gene silencing. Nat Rev Genet. 2015;16(7):421–33. Epub 2015/06/17. 10.1038/nrg3965 - DOI - PubMed
    1. Wightman B, Ha I, Ruvkun G. Posttranscriptional regulation of the heterochronic gene lin-14 by lin-4 mediates temporal pattern formation in C. elegans. Cell. 1993;75(5):855–62. Epub 1993/12/03. - PubMed
    1. Lee RC, Feinbaum RL, Ambros V. The C. elegans heterochronic gene lin-4 encodes small RNAs with antisense complementarity to lin-14. Cell. 1993;75(5):843–54. Epub 1993/12/03. - PubMed

MeSH terms

Substances