. 2017 Feb 27;11(2):e0005376.
doi: 10.1371/journal.pntd.0005376. eCollection 2017 Feb.

The burden of typhoid fever in low- and middle-income countries: A meta-regression approach

Affiliations

The burden of typhoid fever in low- and middle-income countries: A meta-regression approach

Marina Antillón et al. PLoS Negl Trop Dis. .

Abstract

Background: Upcoming vaccination efforts against typhoid fever require an assessment of the baseline burden of disease in countries at risk. There are no typhoid incidence data from most low- and middle-income countries (LMICs), so model-based estimates offer insights for decision-makers in the absence of readily available data.

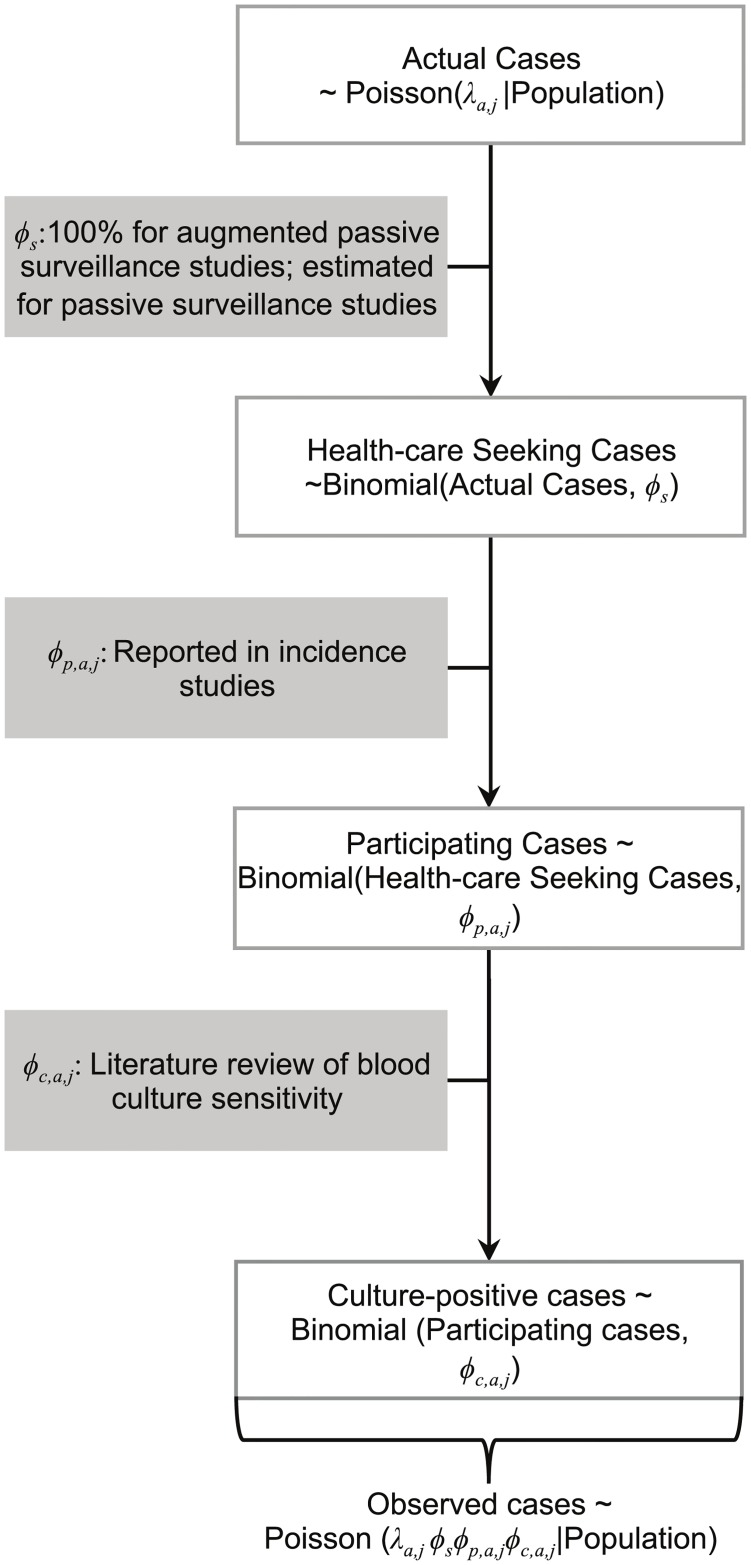
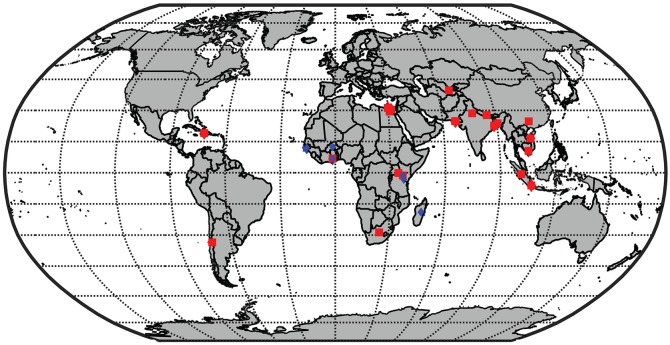
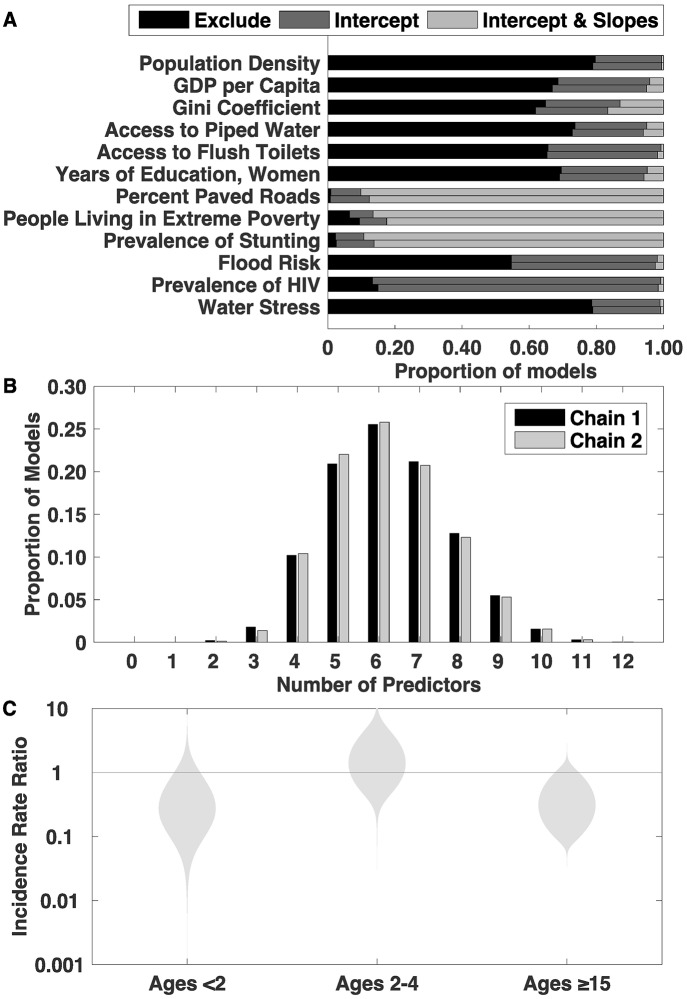
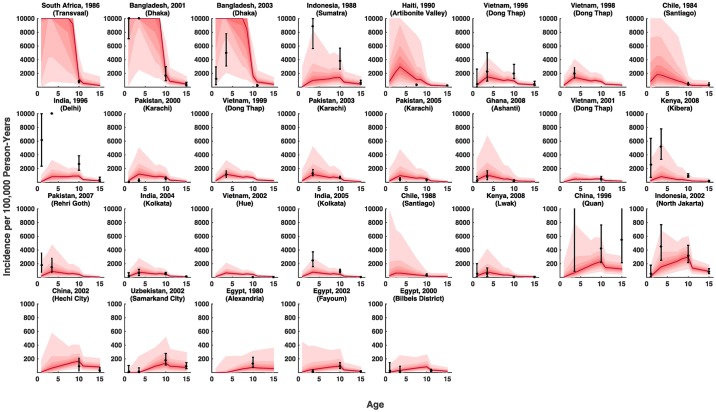
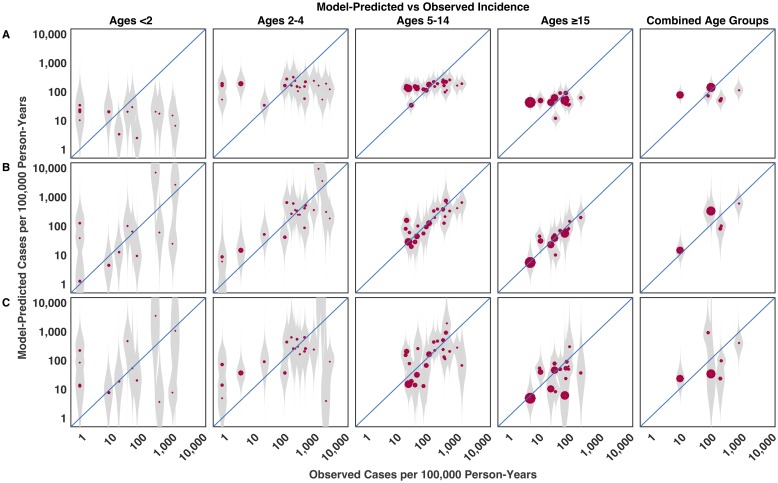
Methods: We developed a mixed-effects model fit to data from 32 population-based studies of typhoid incidence in 22 locations in 14 countries. We tested the contribution of economic and environmental indices for predicting typhoid incidence using a stochastic search variable selection algorithm. We performed out-of-sample validation to assess the predictive performance of the model.

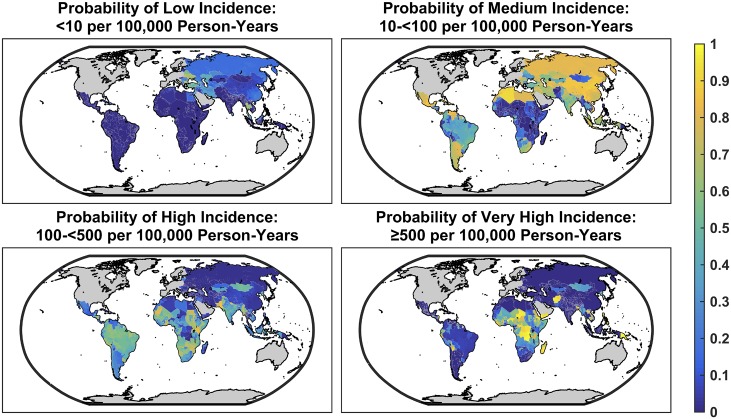
Results: We estimated that 17.8 million cases of typhoid fever occur each year in LMICs (95% credible interval: 6.9-48.4 million). Central Africa was predicted to experience the highest incidence of typhoid, followed by select countries in Central, South, and Southeast Asia. Incidence typically peaked in the 2-4 year old age group. Models incorporating widely available economic and environmental indicators were found to describe incidence better than null models.

Conclusions: Recent estimates of typhoid burden may under-estimate the number of cases and magnitude of uncertainty in typhoid incidence. Our analysis permits prediction of overall as well as age-specific incidence of typhoid fever in LMICs, and incorporates uncertainty around the model structure and estimates of the predictors. Future studies are needed to further validate and refine model predictions and better understand year-to-year variation in cases.


Conflict of interest statement

The authors have declared that no competing interests exist.

Figures

Fig 1
Fig 1. Flowchart of the disease and observation process reflected in our data.
The top of the flowchart consists of all cases of typhoid fever in the population, which is what we are ultimately interested in estimating. However, three intervening (observation) processes result in a considerable difference between the “actual” cases of typhoid fever and the observed cases of typhoid fever. In all, the observation process is made up of the type of surveillance employed in each study (ϕs), the participation rate of patients seen at each of the study clinics (ϕp,a,j, adjusted for age a and study site j), and the sensitivity of blood culture used to confirm typhoid infection (ϕc,a,j, adjusted for age a and study j). We modeled the observed cases as representing the successful trials of a binomial process (the detection process), where the number of trials is Poisson distributed (with a rate parameter equal to the “true” incidence of typhoid cases, λa,j, at age a and study site j); thus, the number of observed cases is a thinned Poisson distribution with rate parameter equal to the product of the disease rate and the probability of a case being detected at each step of the observation process. We used Bayesian priors to account for the observation process and adequately estimate the underlying disease process.
Fig 2
Fig 2. Map of the location of studies in our dataset.
Studies used in the estimation sample are depicted in red and the studies used in the validation sample are depicted in blue. The studies in the validation sample come from the Typhoid Fever Surveillance in Africa Program (TSAP).
Fig 3
Fig 3. Model summary.
A) The posterior marginal probability that each variable was excluded from the model (black) or included as a predictor of the intercept (dark grey) or intercept and slope (light grey) is shown for two chains. Our stochastic search variable selection algorithm could include variables either as a predictor of the intercept (the incidence in 5–14 year olds) or as a predictor of the intercept as well as the slopes (the incidence rate ratios between the other age groups and the referent age group of 5–14 year olds). B) Distribution of the average number of covariates in the model. Chain 1 was initiated using a model that included all the covariates as predictors of the main effect, while chain 2 was initiated as the null model. The null model was never sampled, implying that the models including at least one predictor better described the data than the null model. C) Posterior distributions of age-specific incidence rate ratios between the referent age group (5–14 years of age) and other age groups: <2 years, 2–4 years, ≥15 years old.
Fig 4
Fig 4. Observed versus predicted age-specific incidence rates.
Sites are labeled by location and year, and plots are ordered by decreasing overall model-predicted incidence. The red line and regions represent the model fits—median and 95% credible interval of the expected incidence estimated by the joint posterior distribution of model parameter (excluding study specific random effects and the impact of the observation process). The black symbols are the observed incidence with the 95% credible intervals after adjusting for the observation process: surveillance type (active/augmented passive versus passive surveillance), the participation rate, and blood culture sensitivity. Only studies that reported age-specific incidence are featured here.
Fig 5
Fig 5. Observed versus model-predicted incidence.
(A) Posterior predictions from the null model, which only adjusts for age and the observation process. (B) Posterior predictions from the model using fixed effects for the predictors. (C) Leave-3-out validation results. The gray markers represent the density of model-predicted posterior distributions of incidence, while the red dots represent the median posterior predicted incidence. The size of the red circular markers is proportional to the number of person-years of observation in each study. All predictions are of the mean incidence and were generated using only the fixed-effect terms of the model, and hence do not account for unmeasured location-specific differences, e.g. in healthcare-seeking behavior.
Fig 6
Fig 6. Out-of-sample validation.
The observed versus predicted incidence of typhoid fever is plotted for studies in the Typhoid Fever Surveillance in Africa Program (TSAP) using a model estimated from previously published data identified in our literature review. The numbers represent the median posterior predicted incidence for each TSAP site: 1- Nioko II, Burkina Faso. 2 –Polesgo, Burkina Faso. 3 –Ashanti Akim North, Ghana. 4 –Bandim, Guinea Bissau. 5 –Kibera, Kenya. 6 –Antananarivo, Madagascar. 7 –Imerintsiatosika, Madagascar. 8 –Moshi rural, Tanzania. 9 –Moshi urban, Tanzania. The gray markers represent the density of model-predicted posterior distributions of incidence. The gray horizontal lines represent 95% confidence intervals for the observed incidence.
Fig 7
Fig 7. Model-predicted age-specific incidence per 100,000 person-years.
The median posterior predicted incidence per 100,000 person-years in each of the age groups (<2 years, 2–4 years, 5–14 years, and ≥15 years) is mapped for all low- and middle-income countries (LMICs) with a resolution of 0.1 degrees.
Fig 8
Fig 8. Probability that each location falls into one of four incidence categories: <10, 10-<100, 100-<500, and ≥500 cases per 100,000 person-years, designated as low, medium, high, and very high incidence, respectively.

References

    1. Buckle GC, Walker CLF, Black RE. Typhoid fever and paratyphoid fever: Systematic review to estimate global morbidity and mortality for 2010. J Glob Health. 2012;2: 10401. - PMC - PubMed
    1. Mogasale V, Maskery B, Ochiai RL, Lee JS, Mogasale V V, Ramani E, et al. Burden of typhoid fever in low-income and middle-income countries: a systematic, literature-based update with risk-factor adjustment. Lancet Glob Heal; 2014;2: e570–80. - PubMed
    1. Lee J-S, Mogasale V V., Mogasale V, Lee K. Geographical distribution of typhoid risk factors in low and middle income countries. BMC Infect Dis. BMC Infectious Diseases; 2016;16: 732 10.1186/s12879-016-2074-1 - DOI - PMC - PubMed
    1. Parry CM, Hien TT, Dougan G, White NJ, Farrar JJ. Typhoid fever. N Engl J Med. 2002;347: 1770–82. 10.1056/NEJMra020201 - DOI - PubMed
    1. Bhan MK, Bahl R, Bhatnagar S. Typhoid and paratyphoid fever. Lancet. 2005;366: 749–62. 10.1016/S0140-6736(05)67181-4 - DOI - PubMed

Publication types