. 2017 Feb 27;13(2):e1006226.
doi: 10.1371/journal.ppat.1006226. eCollection 2017 Feb.

The transcriptome of HIV-1 infected intestinal CD4+ T cells exposed to enteric bacteria

Affiliations

The transcriptome of HIV-1 infected intestinal CD4+ T cells exposed to enteric bacteria

Alyson C Yoder et al. PLoS Pathog. .

Abstract

Global transcriptome studies can help pinpoint key cellular pathways exploited by viruses to replicate and cause pathogenesis. Previous data showed that laboratory-adapted HIV-1 triggers significant gene expression changes in CD4+ T cell lines and mitogen-activated CD4+ T cells from peripheral blood. However, HIV-1 primarily targets mucosal compartments during acute infection in vivo. Moreover, early HIV-1 infection causes extensive depletion of CD4+ T cells in the gastrointestinal tract that herald persistent inflammation due to the translocation of enteric microbes to the systemic circulation. Here, we profiled the transcriptome of primary intestinal CD4+ T cells infected ex vivo with transmitted/founder (TF) HIV-1. Infections were performed in the presence or absence of Prevotella stercorea, a gut microbe enriched in the mucosa of HIV-1-infected individuals that enhanced both TF HIV-1 replication and CD4+ T cell death ex vivo. In the absence of bacteria, HIV-1 triggered a cellular shutdown response involving the downregulation of HIV-1 reactome genes, while perturbing genes linked to OX40, PPAR and FOXO3 signaling. However, in the presence of bacteria, HIV-1 did not perturb these gene sets or pathways. Instead, HIV-1 enhanced granzyme expression and Th17 cell function, inhibited G1/S cell cycle checkpoint genes and triggered downstream cell death pathways in microbe-exposed gut CD4+ T cells. To gain insights on these differential effects, we profiled the gene expression landscape of HIV-1-uninfected gut CD4+ T cells exposed to bacteria. Microbial exposure upregulated genes involved in cellular proliferation, MAPK activation, Th17 cell differentiation and type I interferon signaling. Our findings reveal that microbial exposure influenced how HIV-1 altered the gut CD4+ T cell transcriptome, with potential consequences for HIV-1 susceptibility, cell survival and inflammation. The HIV-1- and microbe-altered pathways unraveled here may serve as a molecular blueprint to gain basic insights in mucosal HIV-1 pathogenesis.


Conflict of interest statement

The authors have declared that no competing interests exist.

Figures

Fig 1
Fig 1. TF HIV-1 strains deplete CD4+ T cells in the LPAC model.
(A) LPAC model. LPMCs were obtained from jejunum biopsies of HIV-1-uninfected individuals and used to infect with p24-normalized TF HIV-1 strains in the presence or absence of Prevotella stercorea. CD4+ T cells were analyzed at 6 days post-infection (dpi). (B) Depletion values were computed by comparing the mean absolute numbers of CD3+CD8- cells in triplicate HIV-1 infected versus mock cultures. Negative depletion values can be oftained if the CD3+CD8- cells in HIV-1-infected were greater than mock. (C) %CD4+ T cell killing data were compiled from multiple donors. Lines correspond to means and statistical analyses were performed using a one-way ANOVA followed by a Dunnett’s multiple comparison test. **p<0.01; ***p<0.001; ns, not significant.
Fig 2
Fig 2. HIV-1 infection alters the gene expression profile of gut CD4+ T cells.
LPMCs from 4 different donors were infected with CH040.c-eGFP and at 4 dpi, GFP+ and matched mock-infected CD4+ T cells were sorted for microarray analyses. Paired t-statistics were performed to determine altered genes. (A) Volcano plots showing altered genes in gut CD4+ T cells following HIV-1 infection, based on a 1.25-fold change cut-off and p<0.05. (B) Comparison of HIV-1-altered genes between this study and a published study using X4-tropic HIV-1 on mitogen-activated peripheral blood CD4+ T cells [21]. Genes in blue were downregulated; genes in red were upregulated. (C) Top 30 downregulated and upregulated genes due to HIV-1 infection, based on fold-change values. Colored bars/genes were previously shown to be involved in HIV-1 infection, see S2 Table for more details.
Fig 3
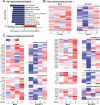
Fig 3. Downregulation of HIV-1 reactome genes in HIV-1-infected gut CD4+ T cells.
Gene expression data were subjected to Gene Set Enrichment Analysis (GSEA). For all Panel A, blue bars/panels indicate downregulation, whereas red bars/panels indicate upregulation relative to mock. Color intensities indicate magnitudes of gene expression (log2 test/reference). (A) Top-ranked gene sets altered in HIV-1-infected gut CD4+ T cells correspond to HIV-1 reactome gene sets. (B) HIV-1 reactome genes (n = 97) from the GSEA in panel A were extracted and a heat map indicating the relative expression in the 4 different LPMC donors are shown. (C) Downregulation of HIV-1 reactome gene sets following HIV-1 infection. Heat maps of genes associated with mRNA processing, transcription, proteasome, TCR-MHC signaling and vesicle transport in HIV-1 infection are shown for each of the 4 LPMC donors analyzed.
Fig 4
Fig 4. HIV-1 alters multiple signaling pathways in gut CD4+ T cells.
Microarray data were subjected to Ingenuity Pathway Analysis (IPA). (A) HIV-1-altered pathways. Bars correspond to log-transformed p-value and colors indicate either pathway activation (orange) or inhibition (blue) based on a Z-score. OX40 and PPAR signaling had the highest Z-scores and p-values. (B) OX40 signaling pathway components and (C) evaluation of OX40 expression in gut CD4+ T cells in 5 LPMC donors by flow cytometry. %OX40+ cells were evaluated in total CD4+ T cells from mock-infected cultures versus HIV-1-eGFP+ cells from HIV-1-infected cultures. (D) PPAR signaling pathway components. For panels B and D, non-gray components correspond to relevant genes in the pathway. This includes genes (black border) or complexes (magenta border) that were upregulated (orange-to-red) or downregulated (green). Blue shapes correspond to components of the pathways being investigated. (E) Upstream regulators, either activated (positive Z-score) or inhibited (negative Z-score) based on IPA. Colored bars correspond to selected upstream regulators discussed in the text.
Fig 5
Fig 5. Microbial exposure enhances TF HIV-1 infection and CD4+ T cell death in the LPAC model.
After spinoculation with the TF HIV-1 CH040.c strain, LPMCs were resuspended in media containing or not containing heat-killed Prevotella stercorea (P.s.) at a 2.5 bacteria: 1 LPMC ratio. Supernatants and cells were analyzed at 6 dpi. (A) Infectious titers. Supernatants were evaluated for infectious HIV-1 titers using TZM-bl reporter cells. Log-transformed firefly luciferase values are shown. (B) CD4+ T cell depletion. The difference in the absolute number of CD3+CD8- T cells between HIV-1 infected and uninfected (mock) LPMC cultures were calculated. Mock controls for CH040.c only was not exposed to P. stercorea, while the mock controls for CH040.c+P.s. were exposed to P. stercorea. For both panels, each connected dot corresponds to a different LPMC donor (n = 9 donors). Data were analyzed using a paired 2-tailed Student’s t test. ***p<0.001.
Fig 6
Fig 6. Microbial exposure alters gut CD4+ T cell gene expression.
HIV-1-uninfected LPMCs were exposed to mock (media) or Prevotella stercorea (2.5 bacteria: 1 LPMC) for 4 days, and sorted gut CD4+ T cells were subjected to microarray analyses. (A) Volcano plots showing differentially regulated genes following microbial exposure. (B) Top 30 ranked down- and upregulated genes in microbe-exposed CD4+ T cells. Colored bars correspond to genes discussed in the text. (C) Ingenuity Pathway Analysis. The pathway with the highest Z-score and p-value is the p38 MAPK pathway.
Fig 7
Fig 7. HIV-1 infection of gut Th17 cells.
(A-B) Relative TF HIV-1 susceptibility of Th17 versus Th1 cells. LPMCs were infected with HIV-1 CH040.c and (A) the percentage of intracellular p24+ cells were evaluated by flow cytometry in IL17 versus IFNγ producing cells at 4 dpi. (B) Data were analyzed using 2-tailed paired Student’s t test; **, p<0.01; *, p<0.05. (C-D) Expression of Th17 differentiation genes. Polarization of blood Th0 cells into Th17 cells was associated with (C) gene upregulation (n = 20 genes) and (D) gene downregulation (n = 18 genes) [42]. These gene lists were extracted from [42] and subjected to GSEA. (C) Upregulated Th17 genes were induced (NOM = 1.54, p = 0.05) in microbe-exposed gut CD4+ T cells. (D) By contrast, downregulated Th17 genes, including RNAses 2, 3 and 6 (in red), were not significantly perturbed (p>0.05). Higher color intensities indicate higher magnitudes of expression changes.
Fig 8
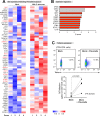
Fig 8. Microbial exposure induces a robust type I IFN signature in gut CD4+ T cells.
(A) ISG expression. Gene set enrichment analyses (GSEA) predicted the upregulation of multiple ISGs in microbe-exposed gut CD4+ T cells. These 62 genes were extracted to generate a heat map detailing individual LPMC donors. Blue bars/panels indicate downregulation, whereas red bars/panels indicate upregulation relative to mock. Higher color intensities indicate magnitudes of gene expression (log2 test/reference values). Genes highlighted in red are known retrovirus restriction factors. (B) IPA-predicted upstream regulators. Red bars correspond to upstream regulators involved in IFN signaling that were discussed in the text. (C) Microbial induction of tetherin/BST-2 on gut CD4+ T cells, as measured by flow cytometry. A representative flow cytometry plot is shown. Data were analyzed using paired 2-tailed Student’s t-test, *, p<0.05.
Fig 9
Fig 9. HIV-1 infection differentially alters multiple pathways in microbe-exposed gut CD4+ T cells.
Prevotella stercorea were utilized as representative enteric bacteria found in the mucosa of HIV-1-infected individuals. (A) Overlap in HIV-1-altered genes between gut CD4+ T cells exposed or not exposed to bacteria. (B) Comparison of HIV-1-altered pathways with or without microbial exposure using Ingenuity Pathway Analyses (IPA). (C) Comparison of HIV-1-altered upstream regulators based on IPA. (D) HIV-1-altered genes in microbe-exposed CD4+ T cells. Colored bars were discussed in the text. (E) Induction of Granzyme B in HIV-1-infected, microbe-exposed gut CD4+ T cells. The percentages of granzyme B+ cells were evaluated in CD3+CD8- cells from mock-infected LPMCs exposed to Prevotella stercorea versus HIV-1-eGFP+ cells from HIV-1-infected LPMCs exposed to Prevotella stercorea. Data were analyzed using a paired 2-tailed Student’s t-test. (F) IPA-predicted downstream effects, based on differentially altered genes.

References

    1. Dalgleish AG, Beverley PC, Clapham PR, Crawford DH, Greaves MF, Weiss RA. The CD4 (T4) antigen is an essential component of the receptor for the AIDS retrovirus. Nature. 1984;312(5996):763–7. - PubMed
    1. Mehla R, Ayyavoo V. Gene array studies in HIV-1 infection. Curr HIV/AIDS Rep. 2012;9(1):34–43. 10.1007/s11904-011-0100-x - DOI - PMC - PubMed
    1. Jekle A, Keppler OT, De Clercq E, Schols D, Weinstein M, Goldsmith MA. In vivo evolution of human immunodeficiency virus type 1 toward increased pathogenicity through CXCR4-mediated killing of uninfected CD4 T cells. Journal of virology. 2003;77(10):5846–54. 10.1128/JVI.77.10.5846-5854.2003 - DOI - PMC - PubMed
    1. Ochsenbauer C, Edmonds TG, Ding H, Keele BF, Decker J, Salazar MG, et al. Generation of transmitted/founder HIV-1 infectious molecular clones and characterization of their replication capacity in CD4 T lymphocytes and monocyte-derived macrophages. Journal of virology. 2012;86(5):2715–28. Epub 2011/12/23. 10.1128/JVI.06157-11 - DOI - PMC - PubMed
    1. Salazar-Gonzalez JF, Salazar MG, Keele BF, Learn GH, Giorgi EE, Li H, et al. Genetic identity, biological phenotype, and evolutionary pathways of transmitted/founder viruses in acute and early HIV-1 infection. The Journal of experimental medicine. 2009;206(6):1273–89. Epub 2009/06/03. 10.1084/jem.20090378 - DOI - PMC - PubMed

Publication types