

Senescent Changes and Topography of the Dark-Adapted Multifocal Electroretinogram
- PMID: 28241320
- PMCID: PMC5341623
- DOI: 10.1167/iovs.16-20953
Senescent Changes and Topography of the Dark-Adapted Multifocal Electroretinogram
Abstract
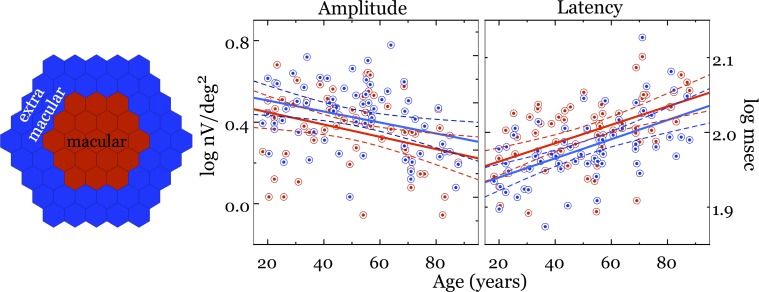
Purpose: To investigate the topographic changes of the dark-adapted multifocal electroretinogram (mfERG) across adulthood in the central retina and compare the topography between macular versus extramacular, nasal versus temporal, and inferior versus superior retinal areas.
Methods: Sixty-five subjects (18-88 years) received a comprehensive dilated eye examination to ensure the health of their retina and were tested with a dark-adapted mfERG protocol using a 61-hexagon pattern. The lens absorption of each subject was also estimated using a heterochromatic flicker photometry (HFP) paradigm.
Results: The response amplitude and latency of the dark-adapted mfERG showed a significant change with age, which was best described with a linear model. All the retinal areas examined demonstrated similar aging effects. The extramacular and temporal retina showed higher response amplitude and faster response latency when compared with the macular and nasal retinae, respectively. No difference was found in response amplitude and latency between the inferior and superior retina. The HFP results also showed a significant correlation with age, consistent with senescent increases in short wavelength absorption by the crystalline lens. However, the change in lens absorption did not exceed the magnitude of the change in response amplitude and latency.
Discussion: Our results indicate that there is a decline in dark-adapted retinal activity as measured with the mfERG. These aging processes affect rods and rod-bipolar cells. Their decrease in response can be attributed to both optical and neural factors.
Figures


Similar articles
-
Aging and mfERG topography.Eye (Lond). 2006 Jan;20(1):18-24. doi: 10.1038/sj.eye.6701777. Eye (Lond). 2006. PMID: 15618974
-
Central retinal function as measured by the multifocal electroretinogram and flicker perimetry in early age-related macular degeneration.Invest Ophthalmol Vis Sci. 2011 Nov 29;52(12):9267-74. doi: 10.1167/iovs.11-8517. Invest Ophthalmol Vis Sci. 2011. PMID: 22039238
-
Mapping cone- and rod-induced retinal responsiveness in macaque retina by optical imaging.Invest Ophthalmol Vis Sci. 2004 Oct;45(10):3820-6. doi: 10.1167/iovs.04-0394. Invest Ophthalmol Vis Sci. 2004. PMID: 15452094
-
Changes in rod and cone-driven oscillatory potentials in the aging human retina.Invest Ophthalmol Vis Sci. 2014 Jul 17;55(8):5058-73. doi: 10.1167/iovs.14-14219. Invest Ophthalmol Vis Sci. 2014. PMID: 25034601
-
Electroretinogram flicker photometry and its applications.J Opt Soc Am A Opt Image Sci Vis. 1996 Mar;13(3):641-8. doi: 10.1364/josaa.13.000641. J Opt Soc Am A Opt Image Sci Vis. 1996. PMID: 8627421 Review.
Cited by
-
Age-associated changes in electroretinography measures in companion dogs.Doc Ophthalmol. 2023 Aug;147(1):15-28. doi: 10.1007/s10633-023-09938-7. Epub 2023 Jun 11. Doc Ophthalmol. 2023. PMID: 37302110 Free PMC article.
References
-
- Jackson GR,, Owsley C,, McGwin G., Jr. Aging and dark adaptation. Vision Res. 1999; 39: 3975–3982. - PubMed
-
- Owsley C,, Jackson GR,, White M,, Feist R,, Edwards D. Delays in rod-mediated dark adaptation in early age-related maculopathy. Ophthalmology. 2001; 108: 1196–1202. - PubMed
-
- Hecht S,, Mandelbaum J. The relation between vitamin A and dark adaptation. JAMA. 1939; 112: 1910–1916.
Publication types
MeSH terms
Grants and funding
LinkOut - more resources
Full Text Sources
Other Literature Sources
Medical
