

The Impact of 3D Stacking and Technology Scaling on the Power and Area of Stereo Matching Processors
- PMID: 28241437
- PMCID: PMC5336097
- DOI: 10.3390/s17020426
The Impact of 3D Stacking and Technology Scaling on the Power and Area of Stereo Matching Processors
Abstract
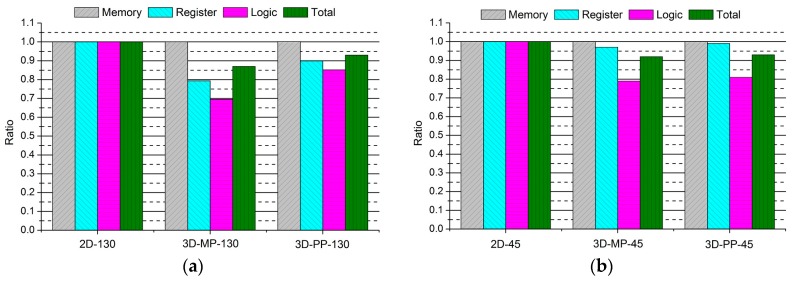
Recently, stereo matching processors have been adopted in real-time embedded systems such as intelligent robots and autonomous vehicles, which require minimal hardware resources and low power consumption. Meanwhile, thanks to the through-silicon via (TSV), three-dimensional (3D) stacking technology has emerged as a practical solution to achieving the desired requirements of a high-performance circuit. In this paper, we present the benefits of 3D stacking and process technology scaling on stereo matching processors. We implemented 2-tier 3D-stacked stereo matching processors with GlobalFoundries 130-nm and Nangate 45-nm process design kits and compare them with their two-dimensional (2D) counterparts to identify comprehensive design benefits. In addition, we examine the findings from various analyses to identify the power benefits of 3D-stacked integrated circuit (IC) and device technology advancements. From experiments, we observe that the proposed 3D-stacked ICs, compared to their 2D IC counterparts, obtain 43% area, 13% power, and 14% wire length reductions. In addition, we present a logic partitioning method suitable for a pipeline-based hardware architecture that minimizes the use of TSVs.
Keywords: low-power; stereo matching processor; technology scaling; through-silicon via.
Conflict of interest statement
The authors declare no conflict of interest.
Figures


Similar articles
-
Analog VLSI implementation for stereo correspondence between 2-D images.IEEE Trans Neural Netw. 1996;7(2):266-77. doi: 10.1109/72.485630. IEEE Trans Neural Netw. 1996. PMID: 18255581
-
A low-cost concurrent TSV test architecture with lossless test output compression scheme.PLoS One. 2019 Aug 23;14(8):e0221043. doi: 10.1371/journal.pone.0221043. eCollection 2019. PLoS One. 2019. PMID: 31442246 Free PMC article.
-
Enabling static random-access memory cell scaling with monolithic 3D integration of 2D field-effect transistors.Nat Commun. 2025 May 26;16(1):4879. doi: 10.1038/s41467-025-59993-8. Nat Commun. 2025. PMID: 40419476 Free PMC article.
-
2D Materials in Logic Technology: Power Efficiency and Scalability in 2DM-MBC CFET.Nano Lett. 2025 May 7;25(18):7224-7233. doi: 10.1021/acs.nanolett.5c01061. Epub 2025 Apr 24. Nano Lett. 2025. PMID: 40272286 Review.
-
Research of Vertical via Based on Silicon, Ceramic and Glass.Micromachines (Basel). 2023 Jul 8;14(7):1391. doi: 10.3390/mi14071391. Micromachines (Basel). 2023. PMID: 37512702 Free PMC article. Review.
References
-
- Szeliski R. Computer Vision: Algorithms and Applications. 1st ed. Springer; New York, NY, USA: 2010. pp. 533–576.
-
- Scharstein D., Szeliski R. A taxonomy and evaluation of dense two-frame stereo correspondence algorithms. Int. J. Comput. Vis. 2002;47:7–42. doi: 10.1023/A:1014573219977. - DOI
-
- Van der Mark W., Gavrila D.M. Real-time dense stereo for intelligent vehicles. IEEE Trans. Intell. Transp. Syst. 2006;7:38–50. doi: 10.1109/TITS.2006.869625. - DOI
-
- DeSouza G.N., Kak A.C. Vision for mobile robot navigation: A survey. IEEE Trans. Pattern Anal. Mach. Intell. 2002;24:237–267. doi: 10.1109/34.982903. - DOI
-
- Howard A. Real-time stereo visual odometry for autonomous ground vehicles; Proceedings of the 2008 IEEE/RSJ International Conference on Intelligent Robots and Systems (IROS 2008); Nice, France. 22–26 September 2008; pp. 3946–3952.
LinkOut - more resources
Full Text Sources
Other Literature Sources
