

Life tables for global surveillance of cancer survival (the CONCORD programme): data sources and methods
- PMID: 28241815
- PMCID: PMC5327577
- DOI: 10.1186/s12885-017-3117-8
Life tables for global surveillance of cancer survival (the CONCORD programme): data sources and methods
Abstract
Background: We set out to estimate net survival trends for 10 common cancers in 279 cancer registry populations in 67 countries around the world, as part of the CONCORD-2 study. Net survival can be interpreted as the proportion of cancer patients who survive up to a given time, after eliminating the impact of mortality from other causes (background mortality). Background mortality varies widely between populations and over time. It was therefore necessary to construct robust life tables that accurately reflected the background mortality in each of the registry populations.
Methods: Life tables of all-cause mortality rates by single year of age and sex were constructed by calendar year for each population and, when possible, by racial or ethnic sub-groups. We used three different approaches, based on the type of mortality data available from each registry. With death and population counts, we adopted a flexible multivariable modelling approach. With unsmoothed mortality rates, we used the Ewbank relational method. Where no data were available from the registry or a national statistical office, we used the abridged UN Population Division life tables and interpolated these using the Elandt-Johnson method. We also investigated the impact of using state- and race-specific life tables versus national race-specific life tables on estimates of net survival from four adult cancers in the United States (US).
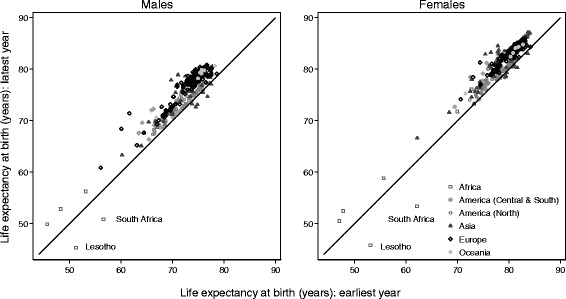
Results: We constructed 6,514 life tables covering 327 populations. Wide variations in life expectancy at birth and mortality by age were observed, even within countries. During 1995-99, life expectancy was lowest in Nigeria and highest in Japan, ranging from 47 to 84 years among females and 46 to 78 years among males. During 2005-09, life expectancy was lowest in Lesotho and again highest in Japan, ranging from 45 to 86 years among females and 45 to 80 years among males. For the US, estimates of net survival differed by up to 4% if background mortality was fully controlled with state- and race-specific life tables, rather than with national race-specific life tables.
Conclusions: Background mortality varies worldwide. This emphasises the importance of using population-specific life tables for geographic and international comparisons of net survival.
Keywords: Cubic splines; Generalised linear model; Global health; Life expectancy; Life tables; Mortality; Net survival.
Figures


References
-
- Allemani C, Weir HK, Carreira H, Harewood R, Spika D, Wang X-S, Bannon F, Ahn JV, Johnson CJ, Bonaventure A, et al. Global surveillance of cancer survival 1995–2009: analysis of individual data for 25,676,887 patients from 279 population-based registries in 67 countries (CONCORD-2) Lancet. 2015;385:977–1010. doi: 10.1016/S0140-6736(14)62038-9. - DOI - PMC - PubMed
-
- Baili P, Micheli A, De Angelis R, Weir HK, Francisci S, Santaquilani M, Hakulinen T, Quaresma M, Coleman MP, CONCORD Working Group Life-tables for world-wide comparison of relative survival for cancer (CONCORD study) Tumori. 2008;94:658–668. - PubMed
Publication types
MeSH terms
Grants and funding
LinkOut - more resources
Full Text Sources
Other Literature Sources
