Comment
. 2017 Feb 27;18(1):42.
doi: 10.1186/s13059-017-1172-8.

Accurate and equitable medical genomic analysis requires an understanding of demography and its influence on sample size and ratio

Affiliations
Comment

Accurate and equitable medical genomic analysis requires an understanding of demography and its influence on sample size and ratio

Michael D Kessler et al. Genome Biol. .

Abstract

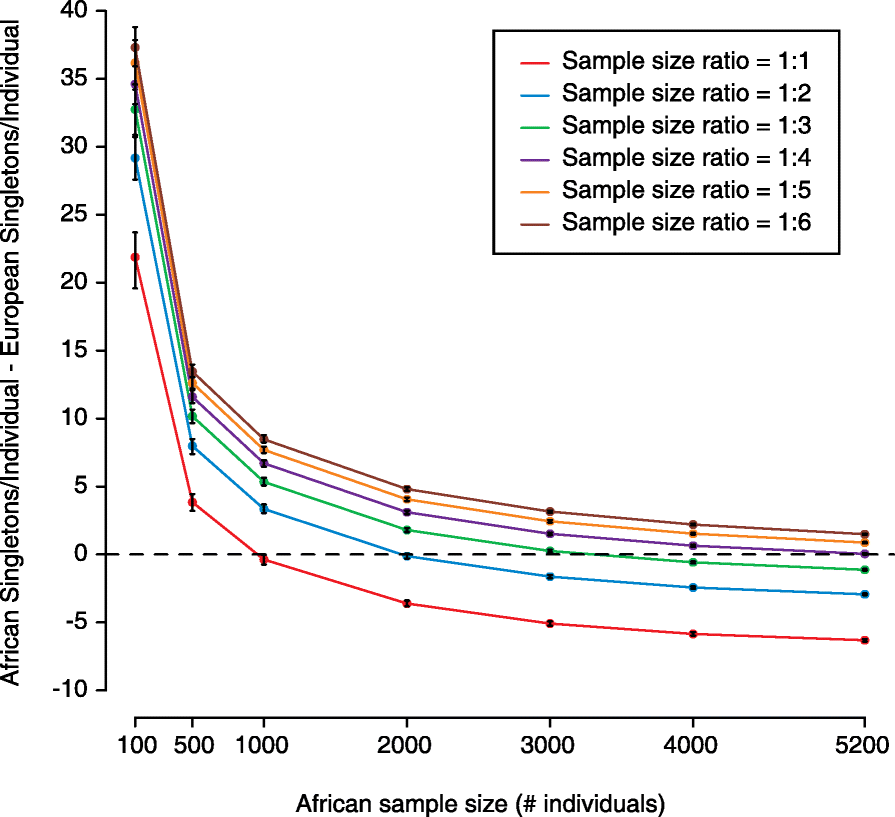
In a recent study, Petrovski and Goldstein reported that (non-Finnish) Europeans have significantly fewer nonsynonymous singletons in Online Mendelian Inheritance in Man (OMIM) disease genes compared with Africans, Latinos, South Asians, East Asians, and other unassigned non-Europeans. We use simulations of Exome Aggregation Consortium (ExAC) data to show that sample size and ratio interact to influence the number of these singletons identified in a cohort. These interactions are different across ancestries and can lead to the same number of identified singletons in both Europeans and non-Europeans without an equal number of samples. We conclude that there is a need to account for the ancestry-specific influence of demography on genomic architecture and rare variant analysis in order to address inequalities in medical genomic analysis.The authors of the original article were invited to submit a response, but declined to do so. Please see related Open Letter: http://genomebiology.biomedcentral.com/articles/10.1186/s13059-016-1016-y.


Figures

Fig. 1
Fig. 1
Simulated numbers of singletons per individual across sample size and ratio in Africans and Europeans. a The number of simulated singletons per individual is shown for Africans (red) and Europeans (blue) at different population sizes. Each panel has a different constant ratio of African to European sample size. Black error bars represent a 95% confidence interval from 200 replicates. b The number of simulated singletons per individual is shown for Africans (red) and Europeans (blue). However, African sample size is held constant in each panel, with African to European sample size ratio varying along the x-axis. Black error bars represent a 95% confidence interval from 200 replicates
Fig. 2
Fig. 2
Difference between Africans and Europeans in number of singletons per individual across sample size and ratio. The difference between African-simulated singletons per individual and European-simulated singletons per individual is plotted along the y-axis. African sample size varies along the x-axis and each colored line represents a different ratio of African to European sample size. Black error bars represent a 95% confidence interval from 200 replicates

Comment on

References

    1. Petrovski S, Goldstein DB. Unequal representation of genetic variation across ancestry groups creates healthcare inequality in the application of precision medicine. Genome Biol. 2016;17:157. doi: 10.1186/s13059-016-1016-y. - DOI - PMC - PubMed
    1. Amberger JS, Bocchini CA, Schiettecatte F, Scott AF, Hamosh A. OMIM.org: Online Mendelian Inheritance in Man (OMIM(R)), an online catalog of human genes and genetic disorders. Nucleic Acids Res. 2015;43:D789–98. doi: 10.1093/nar/gku1205. - DOI - PMC - PubMed
    1. Lek M, Karczewski KJ, Minikel EV, Samocha KE, Banks E, Fennell T, et al. Analysis of protein-coding genetic variation in 60,706 humans. Nature. 2016;536:285–91. doi: 10.1038/nature19057. - DOI - PMC - PubMed
    1. Tennessen JA, Bigham AW, O’Connor TD, Fu W, Kenny EE, Gravel S, et al. Evolution and functional impact of rare coding variation from deep sequencing of human exomes. Science. 2012;337:64–9. doi: 10.1126/science.1219240. - DOI - PMC - PubMed
    1. Fu W, O’Connor TD, Jun G, Kang HM, Abecasis G, Leal SM, et al. Analysis of 6,515 exomes reveals the recent origin of most human protein-coding variants. Nature. 2013;493:216–20. doi: 10.1038/nature11690. - DOI - PMC - PubMed

LinkOut - more resources