

Kinetics of nucleotide entry into RNA polymerase active site provides mechanism for efficiency and fidelity
- PMID: 28242207
- PMCID: PMC5393355
- DOI: 10.1016/j.bbagrm.2017.02.008
Kinetics of nucleotide entry into RNA polymerase active site provides mechanism for efficiency and fidelity
Abstract
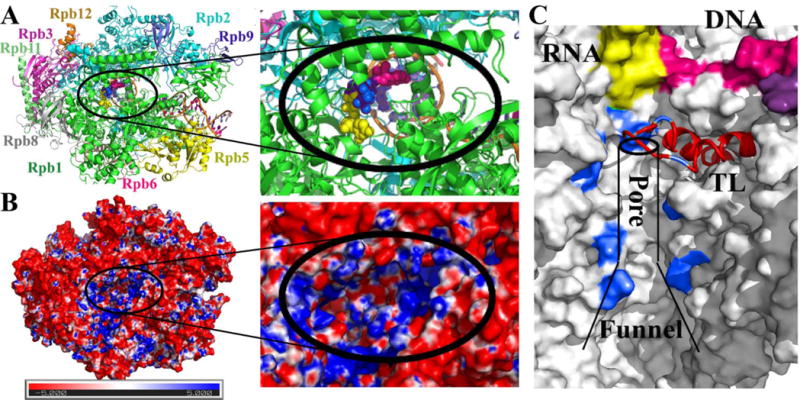
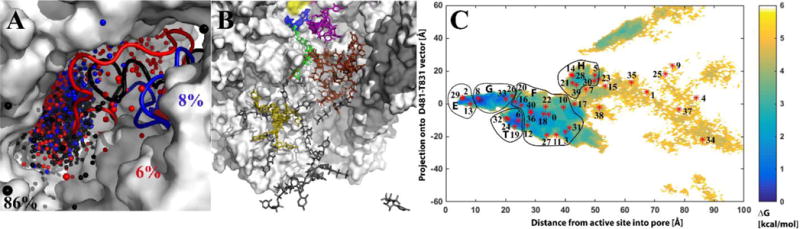
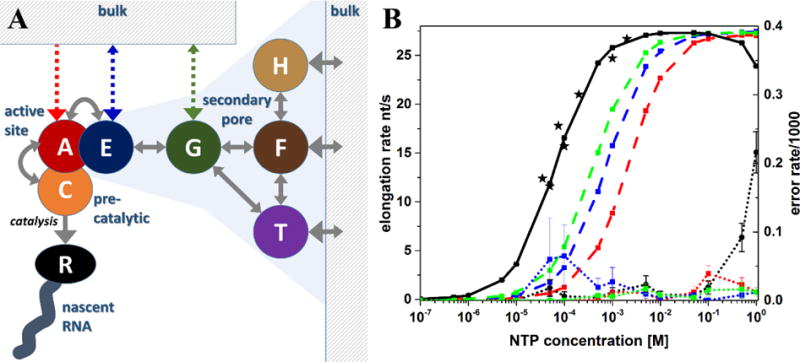
During transcription, RNA polymerase II elongates RNA by adding nucleotide triphosphates (NTPs) complementary to a DNA template. Structural studies have suggested that NTPs enter and exit the active site via the narrow secondary pore but details have remained unclear. A kinetic model is presented that integrates molecular dynamics simulations with experimental data. Previous simulations of trigger loop dynamics and the dynamics of matched and mismatched NTPs in and near the active site were combined with new simulations describing NTP exit from the active site via the secondary pore. Markov state analysis was applied to identify major states and estimate kinetic rates for transitions between those states. The kinetic model predicts elongation and misincorporation rates in close agreement with experiment and provides mechanistic hypotheses for how NTP entry and exit via the secondary pore is feasible and a key feature for achieving high elongation and low misincorporation rates during RNA elongation.
Keywords: Markov state model; Molecular dynamics simulation; NTP discrimination; Network model; Secondary pore.
Copyright © 2017 Elsevier B.V. All rights reserved.
Figures
Similar articles
-
Five checkpoints maintaining the fidelity of transcription by RNA polymerases in structural and energetic details.Nucleic Acids Res. 2015 Jan;43(2):1133-46. doi: 10.1093/nar/gku1370. Epub 2014 Dec 30. Nucleic Acids Res. 2015. PMID: 25550432 Free PMC article.
-
Templated nucleoside triphosphate binding to a noncatalytic site on RNA polymerase regulates transcription.Proc Natl Acad Sci U S A. 2011 Apr 12;108(15):6079-84. doi: 10.1073/pnas.1011274108. Epub 2011 Mar 29. Proc Natl Acad Sci U S A. 2011. PMID: 21447716 Free PMC article.
-
Kinetic investigation of Escherichia coli RNA polymerase mutants that influence nucleotide discrimination and transcription fidelity.J Biol Chem. 2006 Jul 7;281(27):18677-83. doi: 10.1074/jbc.M600543200. Epub 2006 Apr 18. J Biol Chem. 2006. PMID: 16621791
-
A movie of the RNA polymerase nucleotide addition cycle.Curr Opin Struct Biol. 2009 Jun;19(3):294-9. doi: 10.1016/j.sbi.2009.04.005. Epub 2009 May 27. Curr Opin Struct Biol. 2009. PMID: 19481445 Review.
-
NTP-driven translocation and regulation of downstream template opening by multi-subunit RNA polymerases.Biochem Cell Biol. 2005 Aug;83(4):486-96. doi: 10.1139/o05-059. Biochem Cell Biol. 2005. PMID: 16094452 Review.
Cited by
-
Tutorial on how to build non-Markovian dynamic models from molecular dynamics simulations for studying protein conformational changes.J Chem Phys. 2024 Mar 28;160(12):121501. doi: 10.1063/5.0189429. J Chem Phys. 2024. PMID: 38516972 Free PMC article.
-
Nucleotide Loading Modes of Human RNA Polymerase II as Deciphered by Molecular Simulations.Biomolecules. 2020 Sep 7;10(9):1289. doi: 10.3390/biom10091289. Biomolecules. 2020. PMID: 32906795 Free PMC article.
-
Conformational Dynamics of Influenza A Virus Ribonucleoprotein Complexes during RNA Synthesis.ACS Nano. 2024 Jul 16;18(30):19518-27. doi: 10.1021/acsnano.4c01362. Online ahead of print. ACS Nano. 2024. PMID: 39013014 Free PMC article.
-
Role of bacterial RNA polymerase gate opening dynamics in DNA loading and antibiotics inhibition elucidated by quasi-Markov State Model.Proc Natl Acad Sci U S A. 2021 Apr 27;118(17):e2024324118. doi: 10.1073/pnas.2024324118. Proc Natl Acad Sci U S A. 2021. PMID: 33883282 Free PMC article.
-
The Mechanisms of Substrate Selection, Catalysis, and Translocation by the Elongating RNA Polymerase.J Mol Biol. 2019 Sep 20;431(20):3975-4006. doi: 10.1016/j.jmb.2019.05.042. Epub 2019 May 31. J Mol Biol. 2019. PMID: 31153902 Free PMC article. Review.
References
-
- Ninio J. Connects between translation, transcription and replication error rates. Biochimie. 1991;73:1517–1523. - PubMed
-
- Thomas MJ, Platas AA, Hawley DK. Transcriptional fidelity and proofreading by RNA polymerase II. Cell. 1998;93:627–637. - PubMed
-
- Erie DA, Yager TD, Vonhippel PH. The single-nucleotide addition cycle in transcription - a biophysical and biochemical perspective. Annu Rev Biophys Biomol Struct. 1992;21:379–415. - PubMed
-
- Cramer P, Armache KJ, Baumli S, Benkert S, Brueckner F, Buchen C, Damsma GE, Dengl S, Geiger SR, Jasiak AJ, Jawhari A, Jennebach S, Kamenski T, Kettenberger H, Kuhn CD, Lehmann E, Leike K, Sydow JF, Vannini A. Structure of eukaryotic RNA polymerases. Annu Rev Biophys. 2008;37:337–352. - PubMed
Publication types
MeSH terms
Substances
Grants and funding
LinkOut - more resources
Full Text Sources
Other Literature Sources
