. 2017 Feb 27;6(3):e004694.
doi: 10.1161/JAHA.116.004694.

Divergent Effects of miR-181 Family Members on Myocardial Function Through Protective Cytosolic and Detrimental Mitochondrial microRNA Targets

Affiliations

Divergent Effects of miR-181 Family Members on Myocardial Function Through Protective Cytosolic and Detrimental Mitochondrial microRNA Targets

Samarjit Das et al. J Am Heart Assoc. .

Abstract

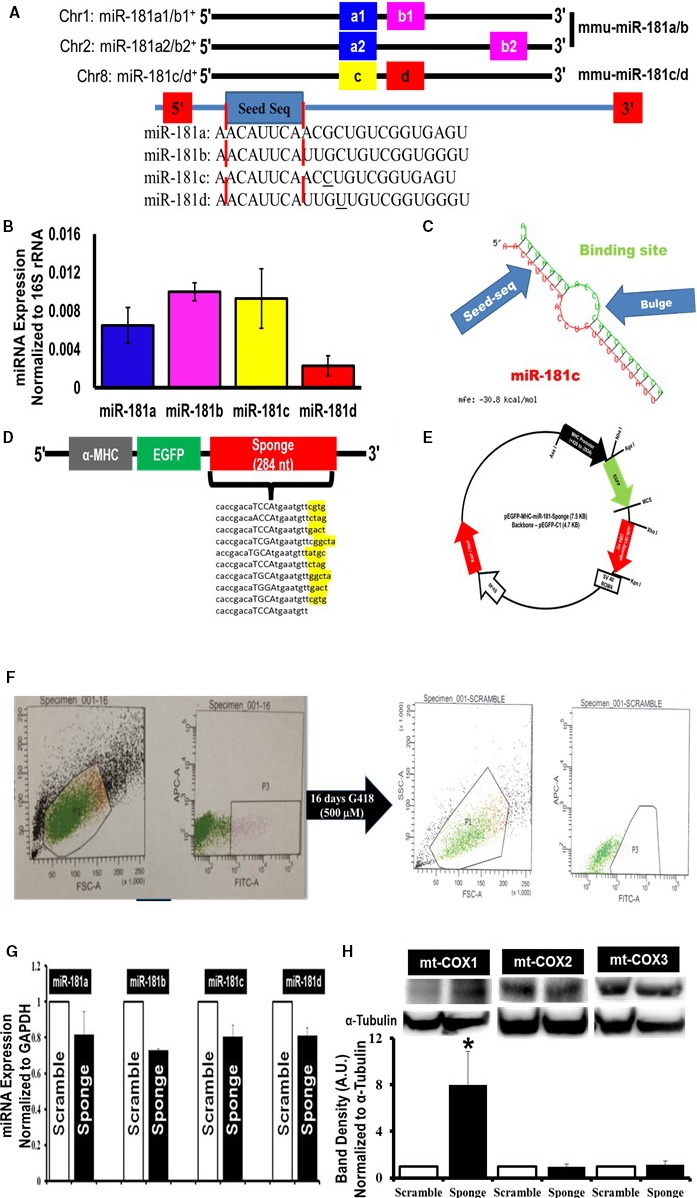
Background: MicroRNA (miRNA) is a type of noncoding RNA that can repress the expression of target genes through posttranscriptional regulation. In addition to numerous physiologic roles for miRNAs, they play an important role in pathophysiologic processes affecting cardiovascular health. Previously, we reported that nuclear encoded microRNA (miR-181c) is present in heart mitochondria, and importantly, its overexpression affects mitochondrial function by regulating mitochondrial gene expression.

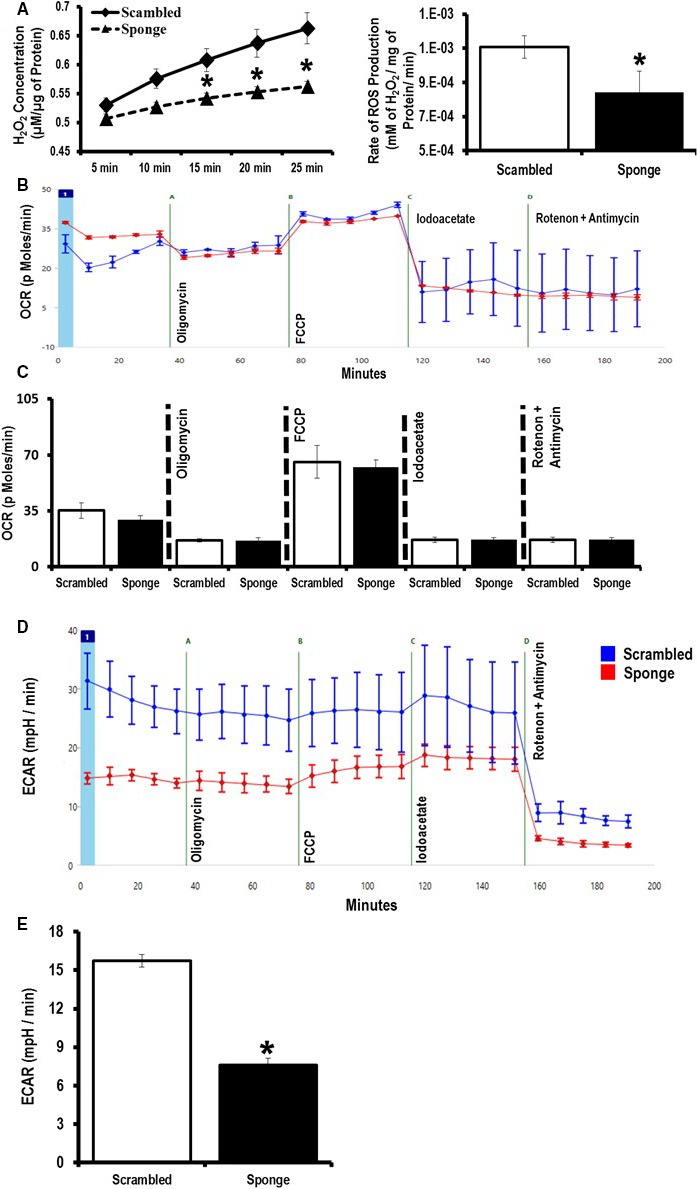
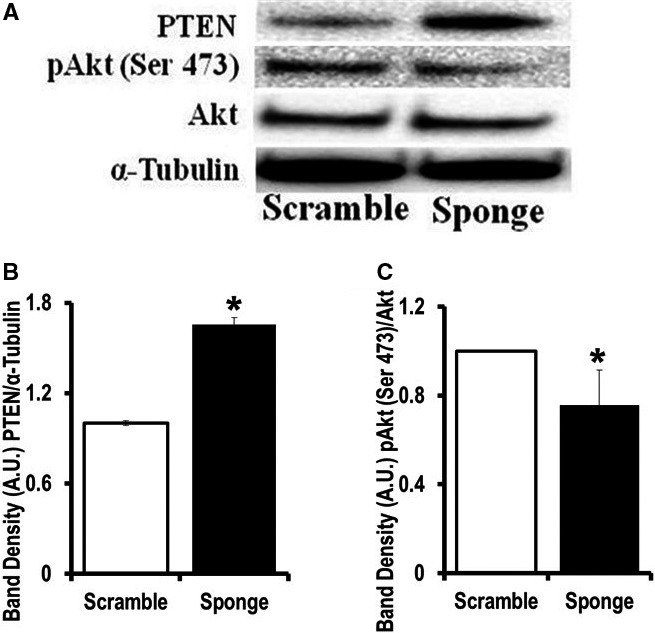
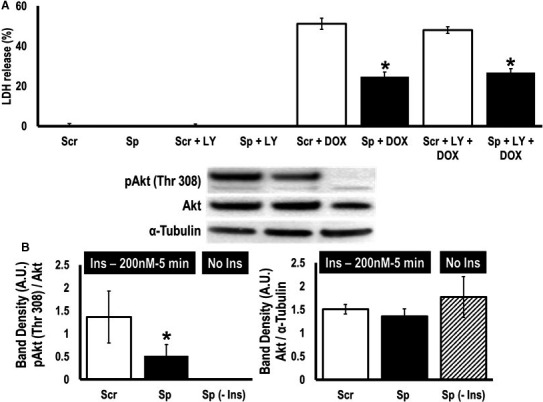
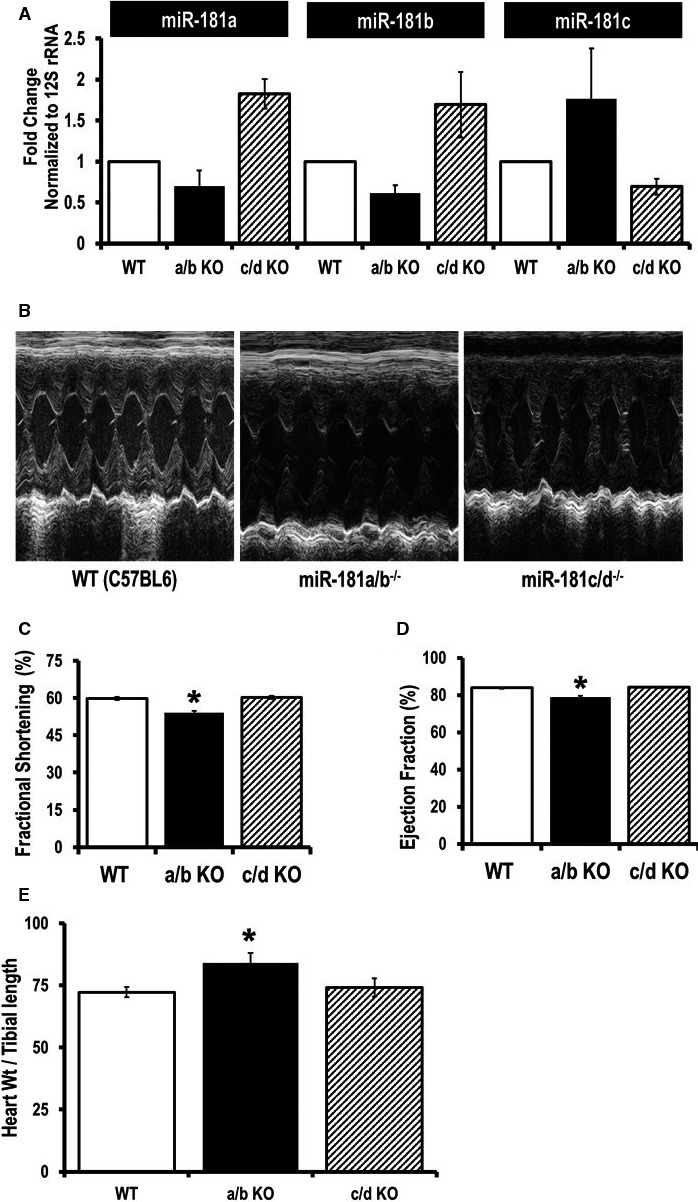
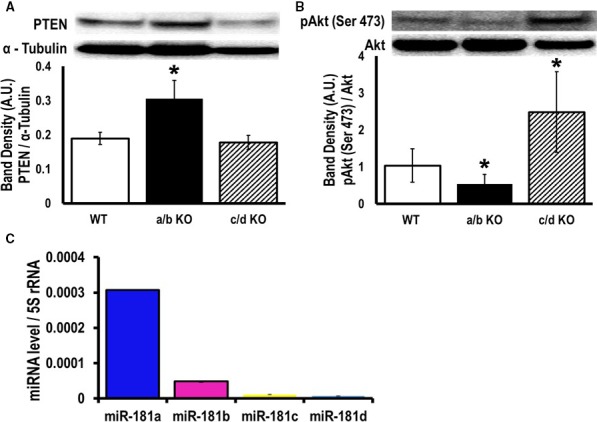
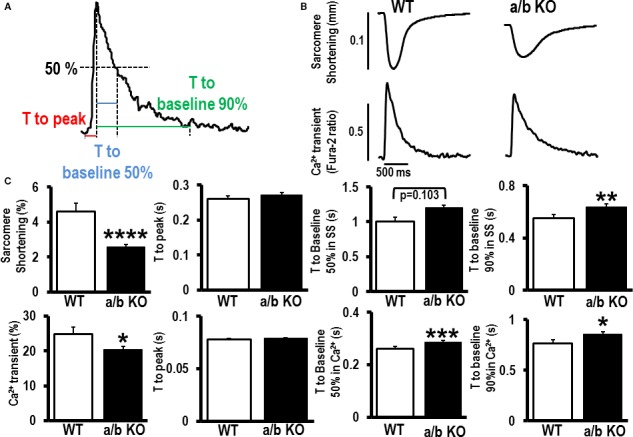
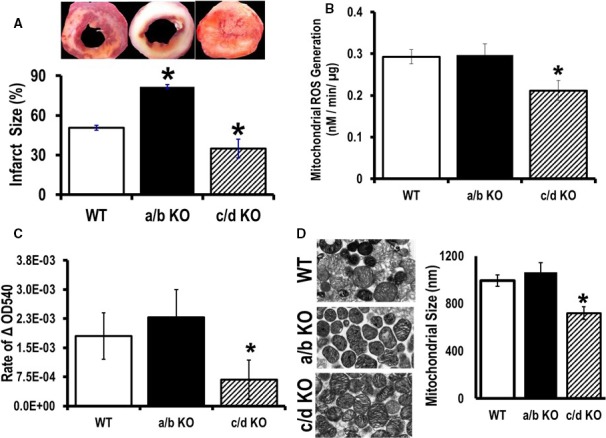
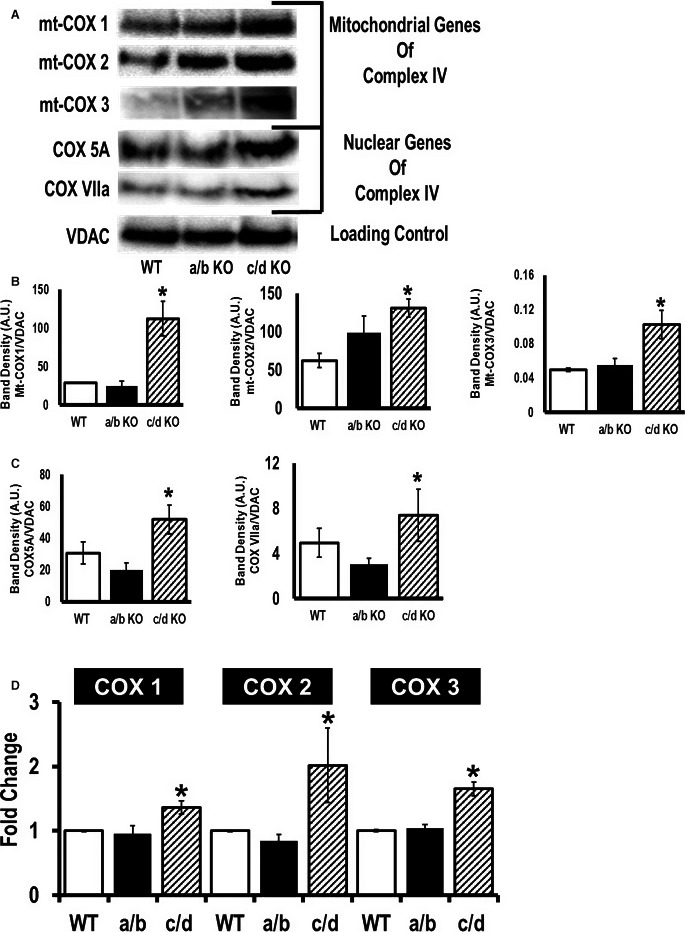
Methods and results: To investigate further how the miR-181 family affects the heart, we suppressed miR-181 using a miR-181-sponge containing 10 repeated complementary miR-181 "seed" sequences and generated a set of H9c2 cells, a cell line derived from rat myoblast, by stably expressing either a scrambled or miR-181-sponge sequence. Sponge-H9c2 cells showed a decrease in reactive oxygen species production and reduced basal mitochondrial respiration and protection against doxorubicin-induced oxidative stress. We also found that miR-181a/b targets phosphatase and tensin homolog (PTEN), and the sponge-expressing stable cells had increased PTEN activity and decreased PI3K signaling. In addition, we have used miR-181a/b-/- and miR-181c/d-/- knockout mice and subjected them to ischemia-reperfusion injury. Our results suggest divergent effects of different miR-181 family members: miR-181a/b targets PTEN in the cytosol, resulting in an increase in infarct size in miR-181a/b-/- mice due to increased PTEN signaling, whereas miR-181c targets mt-COX1 in the mitochondria, resulting in decreased infarct size in miR-181c/d-/- mice.

Conclusions: The miR-181 family alters the myocardial response to oxidative stress, notably with detrimental effects by targeting mt-COX1 (miR-181c) or with protection by targeting PTEN (miR-181a/b).

Keywords: PI3 kinase; miR‐181; microRNA; mitochondria; mitochondrial miRNA; mitochondrial respiratory complex IV; mt‐COX1; oxidative stress; phosphatase and tensin homolog; reperfusion injury.


Figures

Figure 1
Figure 1
Mitochondrial localization of microRNA‐181 (miR‐181) family and miRNA‐family‐wide knockdown strategy. A, Schematic depiction of mouse miR‐181 family. Two independent paralog transcripts of miR‐181a/b precursors—miR‐181a1/a2 (blue) and miR‐181b1/b2 (pink). The names of the mature miRNAs are denoted in the boxes. The blue box with “seed” labels in the box highlights the conserved sequence among all 4 mature miR‐181, indicated inside the red dotted lines. B, Quantitative polymerase chain reaction (qPCR) (SYBR kit) analysis of miR‐181 family (a, b, c, and d) expression in total RNA from the mitochondrial pellets of C57BL6/J mouse hearts. The miRNA expression was normalized to mitochondrial 16S rRNA. C, Predicted structure of miR‐181 sponge and miR‐181 family. The red side of this structure is miR‐181 family, in this particular case miR‐181c. The green side is 1 of the 10 transcripts of miR‐181 sponge. The binding site shows the antisequence of the seed sequence of miR‐181. The bulge formation gives stability to the structure. The energy required for the stability of this structure is −30.8 kcal/mol. D, Design of an EGFP (enhanced green fluorescent protein) expression construct under the regulation of a heart‐specific promoter, α‐myosin heavy chain (α‐MHC) and containing either the miR‐181 sponge construct (sponge) or scramble sequence (scramble, not shown). The 4 nucleotides indicated with capital letters immediately after the anti‐miR‐181 seed sequence are the spacer, and nucleotides highlighted in yellow after each of the 9 anti‐miR‐181 sequences are the spacer between each anti‐miR‐181 seed sequence. E, Cardiospecific miR‐181 sponge vector map. F, Generation of cardiospecific miR‐181‐sponge‐H9c2 and cardiospecific scramble‐H9c2 from single‐cell clones. Gate P3 in the left part of F represents the green fluorescent protein–positive (GFP +) H9c2 cells, only 8.2% of total number of H9c2 cells, which were sorted and cultured for another 16 days with G418. Gate P3 in the right part of F represents GFP + H9c2 cells, 60% of the total number of cells, which were again sorted and seeded at 5 to 10 cells/well of a 96‐well plate. G, Quantitative PCR data examining miR‐181 family expression in the stable miR‐181‐sponge‐H9c2 (sponge) and the scrambled‐sponge H9c2 (scramble) cells. A slight decrease of the entire miR‐181 family, miR‐181a, b, c, and d, was decreased in the EGFP‐miR‐181‐sponge–expressing group, compared to EGFP‐miR‐181‐scramble‐H9c2 cells. We normalized the data to the GAPDH expression. H, Western blot analysis of mitochondrial cytochrome c oxidase (mt‐COX) expression in miR‐181‐sponge and scramble‐sponge H9c2 cells. The mt‐COX1 (upper band, left side), mt‐COX2 (upper band, in the middle) and mt‐COX3 (upper band, right side) expression was normalized to α‐tubulin (lower bands). Bar graphs show the quantification of protein expression. Protein lysate was prepared from the whole cell pellets. *P<0.05 vs scramble (n=3).
Figure 2
Figure 2
Effect of microRNA (miR)‐181‐sponge on mitochondrial function and cellular metabolism. A, Measurement of H2O2 production as an indicator of reactive oxygen species (ROS) generated from the miR‐181‐sponge and scrambled sponge H9c2 cell lines. B, Representative trace for the mitochondrial O2 consumption rate (OCR). C, Analysis of OCR under basal and after addition of oligomycin, carbonilcyanide p‐triflouromethoxyphenylhydrazone (FCCP), iodoacetate, and rotenone/antimycin in miR‐181‐sponge compared to scramble‐expressed H9c2 cells. D, Representative trace for extracellular acidification rates (ECAR). E, Analysis of glycolysis using ECAR, in miR‐181‐sponge compared to scramble‐expressed H9c2 cells. *P<0.05 vs scramble (n=8).
Figure 3
Figure 3
MicroRNA (miR)‐181‐sponge‐expressing cells have upregulated PTEN expression. A, Western blot analysis of phosphatase and tensin homolog (PTEN), phospho‐Akt Ser 473, and total Akt expression in the miR‐181‐sponge‐H9c2 and scramble‐sponge–expressing cells. Lysates were probed with the indicated antibodies. α‐Tubulin is a loading control. B and C, Band‐densitometry is indicated. B, *P<0.05 vs EGFP‐scramble‐H9c2. C, *P<0.05 vs scramble (n=4).
Figure 4
Figure 4
MicroRNA (miR)‐181‐sponge protects cells against oxidative stress induced by doxyrubicin. A, Analysis of doxorubicin (DOX) treatment on cellular viability. Lactic acid dehydrogenase release, in scramble‐sequence (Scr)‐ and miR‐181‐sponge (Sp)‐expressing cells treated with 10 μmol/L with/without LY294002 (LY) for 48 hours. *P<0.05 vs corresponding scramble (n=8). B, Western blot analysis of pAkt Thr 308, and total Akt expression in the scramble‐sponge (Scr)‐ and miR‐181‐sponge (Sp)‐expressing cells pretreated with insulin (200 nmol/L) for 5 minutes after 16 hours of serum starvation. We have used miR‐181‐sponge untreated group (Sp‐Ins) as a negative control for insulin treatment. Lysates were probed with the indicated antibodies. Total Akt was used as a normalization control for pAkt (Thr 308). We also used α‐tubulin to normalize total Akt expression. *P<0.05 vs scramble (n=4).
Figure 5
Figure 5
Examination of cardiac function in miR‐181a/b−/− and miR‐181c/d−/− mice. A, Quantitative polymerase chain reaction (SYBR kit) analysis of miR‐181a, b, and c expression in total RNA from the heart tissues of miR‐181a/b−/− (a/b KO), and miR‐181c/d−/− (c/d KO) mice. The miRNA expression was normalized to mitochondrial 16S rRNA. B, Two‐dimensional M‐mode and Doppler echocardiography were performed on nonanesthetized 12 week old mice: wild type (WT C57BL6) mice (left), miR‐181a/b−/− mice (middle panel), and miR‐181c/d−/− mice (right). C, Percentage fractional shortening and (D) ejection fraction were calculated using the software of the echocardiography instrument (n=8). E, Signs of hypertrophy (heart weight/tibial length) were measured (n=5). *P<0.05 vs WT.
Figure 6
Figure 6
MicroRNA (miR)‐181a/b inhibits PI3K pathway activity in the miR‐181a/b−/− mouse heart through modulation of phosphatase and tensin homolog (PTEN). Western blot analysis of (A) PTEN, (B) phosphorylation of Akt (pAkt) Ser 473, and total Akt expression in the heart from wild type (WT), miR‐181a/b−/−, and miR‐181c/d−/− knockout mice whole‐heart homogenates were probed with the indicated antibodies. α‐Tubulin is a loading control. Band densitometry is shown in the bar graph. C, Quantitative polymerase chain reaction (SYBR kit) analysis of miR‐181 family (a, b, c, and d) expression in total RNA from the heart homogenate of WT mouse hearts. miRNA expression was normalized to 5S r RNA. *P<0.05 vs WT, n=4.
Figure 7
Figure 7
Role of microRNA (miR)‐181a/b in the fundamental changes in cardiomyocyte contractility. A, Definitions for calcium (Ca2+) transient analysis. B, Representative sarcomere shortening and Ca2+ transients for miR‐181a/b−/− (a/b KO) mouse myocytes compared to wild type (WT) C57BL/6J adult myocytes. C, Quantification of peak amplitude of sarcomere shortening and Ca2+ transients, time to peak, time to 50% and 90% return to baseline measured with WT (n=20) and a/b KO (n=73‐75) mouse myocytes. Data are mean±SEM; *P<0.05; **P<0.01; ***P<0.001; ****P<0.0001.
Figure 8
Figure 8
Cardiopretective effect of microRNA (miR)‐181c/d−/− from ischemia/reperfusion injury. A, Infarct size was calculated after 20 minutes of global ischemia, followed by 2 hours of reperfusion from 3 groups of animals: wild type (WT), miR‐181a/b−/−, and miR‐181c/d−/−. B, Rate of reactive oxygen species (ROS) generation and (C) mitochondrial swelling was measured from isolated heart mitochondria from the 3 groups of mice: WT, miR‐181a/b−/− (a/b KO), and miR‐181c/d−/− (c/d KO), using glutamate/malate as a substrate. D, Electron microscopy of mitochondria isolated from mouse hearts. Representative pictures of the 3 groups of animals, WT, miR‐181a/b−/− (a/b KO), and miR‐181c/d−/− (c/d KO), is shown on the left side. Transmission electron microscope measurement of average longitudinal mitochondrion size is represented by a bar graph on the right side. *P<0.05 vs WT (n=6).
Figure 9
Figure 9
Higher mitochondrial complex IV expression leads to cardioprotection from ischemia/reperfusion injury in microRNA (miR)‐181c/d−/− mice. Western blot analysis of mitochondrial cytochrome c oxidase subunit 1 (mt‐COX1), mitochondrial cytochrome c oxidase subunit 2 (mt‐COX2), mitochondrial cytochrome c oxidase subunit 3 (mt‐COX3), cytochrome c oxidase subunit 5A (COX 5A), cytochrome c oxidase subunit 5B (COX 5B), and cytochrome c oxidase subunit VIIa (COX VIIa) expression in the mitochondrial fraction of the heart from 3 different groups of mice, wild type (WT), miR‐181a/b−/−, and miR‐181c/d−/−. Mitochondrial extracts were probed with the indicated antibodies. VDAC (lower band) is a loading control. A, Representative bands are shown in different groups based on the genomic locations. B, Band‐densitometry of mitochondrial genes, mt‐COX1, mt‐COX2, and mt‐COX3, were tabulated in the bar graphs. C, Band densitometry of nuclear genes COX 5A, COX 5B, and COX VIIa, were tabulated in the bar graphs. D, Quantitative polymerase chain reaction (SYBR kit) analysis of the complex IV genes, encoded by the mitochondrial genome, using total RNA from the hearts of C57BL6/J (WT), miR‐181a/b−/− (a/b), and miR‐181c/d−/− (c/d) mice. The mt‐COX1, mt‐COX2, and mt‐COX3 expressions were normalized to mitochondrial 16S rRNA. *P<0.05 vs WT, n=4.

References

    1. Chen JQ, Cammarata PR, Baines CP, Yager JD. Regulation of mitochondrial respiratory chain biogenesis by estrogens/estrogen receptors and physiological, pathological and pharmacological implications. Biochim Biophys Acta. 2009;1793:1540–1570. - PMC - PubMed
    1. Lam MP, Scruggs SB, Kim TY, Zong C, Lau E, Wang D, Ryan CM, Faull KF, Ping P. An MRM‐based workflow for quantifying cardiac mitochondrial protein phosphorylation in murine and human tissue. J Proteomics. 2012;75:4602–4609. - PMC - PubMed
    1. Das S, Steenbergen C. Mitochondrial adenine nucleotide transport and cardioprotection. J Mol Cell Cardiol. 2012;52:448–453. - PMC - PubMed
    1. Steenbergen C, Das S, Su J, Wong R, Murphy E. Cardioprotection and altered mitochondrial adenine nucleotide transport. Basic Res Cardiol. 2009;104:149–156. - PMC - PubMed
    1. Ambros V. The functions of animal microRNAs. Nature. 2004;431:350–355. - PubMed