. 2017 Mar 14;114(11):2940-2945.
doi: 10.1073/pnas.1614190114. Epub 2017 Feb 27.

Microbial community assembly and evolution in subseafloor sediment

Affiliations

Microbial community assembly and evolution in subseafloor sediment

Piotr Starnawski et al. Proc Natl Acad Sci U S A. .

Abstract

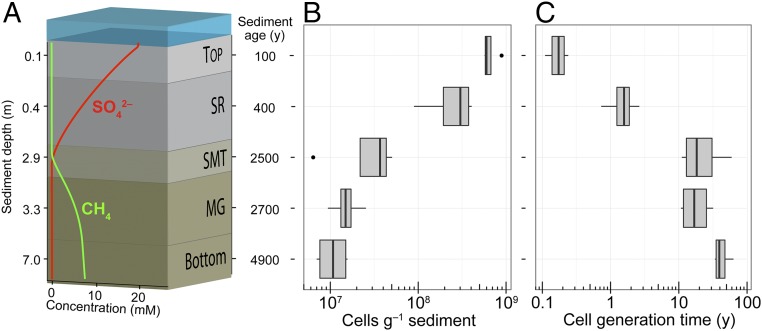
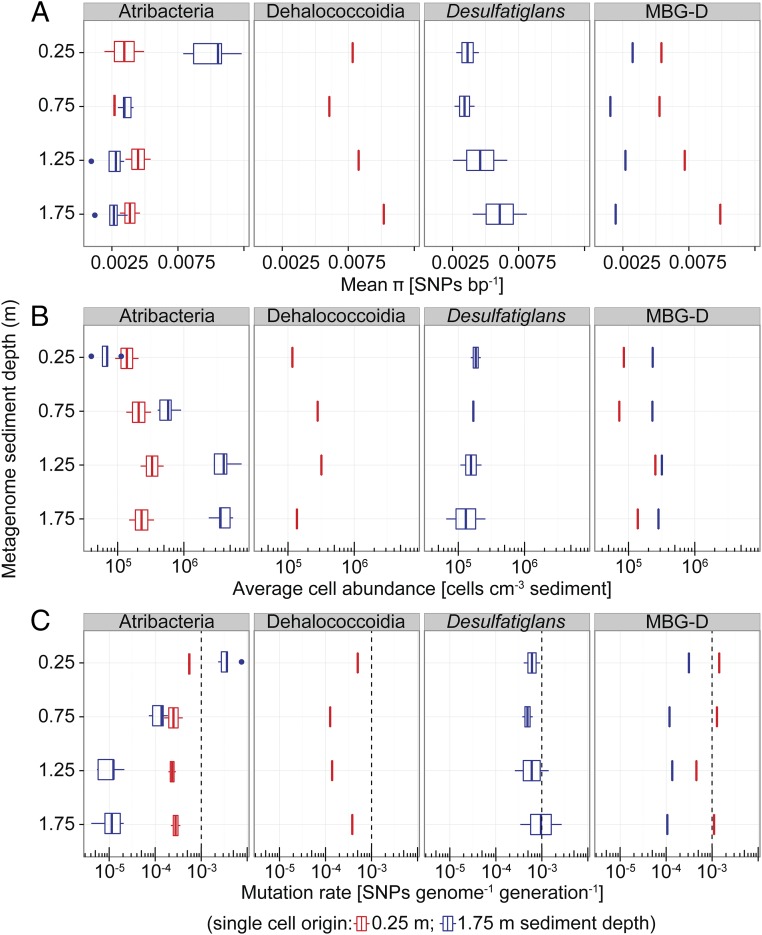
Bacterial and archaeal communities inhabiting the subsurface seabed live under strong energy limitation and have growth rates that are orders of magnitude slower than laboratory-grown cultures. It is not understood how subsurface microbial communities are assembled and whether populations undergo adaptive evolution or accumulate mutations as a result of impaired DNA repair under such energy-limited conditions. Here we use amplicon sequencing to explore changes of microbial communities during burial and isolation from the surface to the >5,000-y-old subsurface of marine sediment and identify a small core set of mostly uncultured bacteria and archaea that is present throughout the sediment column. These persisting populations constitute a small fraction of the entire community at the surface but become predominant in the subsurface. We followed patterns of genome diversity with depth in four dominant lineages of the persisting populations by mapping metagenomic sequence reads onto single-cell genomes. Nucleotide sequence diversity was uniformly low and did not change with age and depth of the sediment. Likewise, there was no detectable change in mutation rates and efficacy of selection. Our results indicate that subsurface microbial communities predominantly assemble by selective survival of taxa able to persist under extreme energy limitation.

Keywords: bacteria; evolution; marine sediment; metagenomics; single-cell genomics.


Conflict of interest statement

The authors declare no conflict of interest.

Figures

Fig. 1.
Fig. 1.
Vertical biogeochemical zonation and distribution of microbial biomass and turnover in Aarhus Bay sediments. (A) Biogeochemical zonation. Top, surface sediment; SR, upper sulfate-rich sediment; SMT, sulfate–methane transition zone; MG, methanogenic sediment; Bottom, deep methanogenic zone. Pore water concentrations of sulfate and methane and sediment depth and age relate to Station M29A (SI Appendix, Table S1). Sediment depth and age axes are not drawn to scale. (B) Microbial cell abundances determined by qPCR quantification of 16S rRNA genes in extracted DNA assuming that bacterial and archaeal cells on average harbor 4.1 and 1.6 gene copies, respectively. (C) Average generation time for cells as estimated from cell-specific rates of carbon oxidation, cellular carbon content, and growth yield (Materials and Methods). In the box-and-whisker plots, the middle line represents the median value for four different sampling stations and horizontal lines represent minimum and maximum values. The box stretches from the lower to the upper quartile and dots show outliers (>1.5 times the corresponding quartile).
Fig. 2.
Fig. 2.
Persisting OTUs and potential for population growth. (A) Abundance of 16S rRNA gene sequence OTUs persisting across different biogeochemical sediment zones. Top, total number of OTUs in the top zone. All other zones: number of OTUs from the Top zone that persist at each of these zones. Bottom: Number of OTUs persisting throughout all zones. (B) Relative abundance in each zone of the OTUs persisting throughout all zones. (C) Cumulative number of cell generations during burial, estimated from cell-generation times (Fig. 1C) and sediment age (Materials and Methods). Bar plots in A and B show mean ± SD for four sampling stations. Top, surface sediment; SR, upper sulfate-rich sediment; SMT, sulfate–methane transition zone; MG, methanogenic zone; Bottom, deep methanogenic zone.
Fig. 3.
Fig. 3.
Genetic diversity and rates of evolution within subsurface microbial populations. (A) Genome nucleotide diversity (π) as measured by mapping metagenome reads onto genomes of single cells derived from 0.25 m or 1.75 m sediment depth and quantifying the number of SNPs. Taxonomic names indicate the identities of the single-cell genomes (Atribacteria, n = 7; Dehalococcoidia, n = 1; Desulfatiglans, n = 2; MBG-D, n = 2; SI Appendix, Table S3). (B) Abundance of the populations represented by the single cells as inferred by multiplying the fraction of reads within a metagenomic library that mapped to the SAGs by microscopic total cell counts from the respective sediment depths. (C) Mutation rates (µg) calculated according to µg = π/2Ne, assuming that effective population size (Ne) equals the total population size shown in B and using π and the estimated genome sizes to infer SNPs genome−1 (Materials and Methods). The dashed lines show, for comparison, the µg of growing E. coli cultures. Box-and-whisker plots are as defined in Fig. 1.

References

    1. Kallmeyer J, Pockalny R, Adhikari RR, Smith DC, D’Hondt S. Global distribution of microbial abundance and biomass in subseafloor sediment. Proc Natl Acad Sci USA. 2012;109(40):16213–16216. - PMC - PubMed
    1. Parkes RJ, et al. A review of prokaryotic populations and processes in sub-seafloor sediments, including biosphere:geosphere interactions. Mar Geol. 2014;352:409–425.
    1. Lomstein BA, Langerhuus AT, D’Hondt S, Jørgensen BB, Spivack AJ. Endospore abundance, microbial growth and necromass turnover in deep sub-seafloor sediment. Nature. 2012;484(7392):101–104. - PubMed
    1. Langerhuus AT, et al. Endospore abundance and D:L-amino acid modelling of bacterial turnover in Holocene marine sediment (Aarhus Bay) Geochim Cosmochim Acta. 2012;99:87–99.
    1. Middelburg JJ. A simple rate model for organic matter decomposition in marine sediments. Geochim Cosmochim Acta. 1989;53:1577–1581.

Publication types

LinkOut - more resources