. 2017 Mar 14;114(11):E2068-E2076.
doi: 10.1073/pnas.1615195114. Epub 2017 Feb 27.

Quantification of labile heme in live malaria parasites using a genetically encoded biosensor

Affiliations

Quantification of labile heme in live malaria parasites using a genetically encoded biosensor

James R Abshire et al. Proc Natl Acad Sci U S A. .

Abstract

Heme is ubiquitous, yet relatively little is known about the maintenance of labile pools of this cofactor, which likely ensures its timely bioavailability for proper cellular function. Quantitative analysis of labile heme is of fundamental importance to understanding how nature preserves access to the diverse chemistry heme enables, while minimizing cellular damage caused by its redox activity. Here, we have developed and characterized a protein-based sensor that undergoes fluorescence quenching upon heme binding. By genetically encoding this sensor in the human malarial parasite, Plasmodium falciparum, we have quantified cytosolic labile heme levels in intact, blood-stage parasites. Our findings indicate that a labile heme pool (∼1.6 µM) is stably maintained throughout parasite development within red blood cells, even during a period coincident with extensive hemoglobin degradation by the parasite. We also find that the heme-binding antimalarial drug chloroquine specifically increases labile cytosolic heme, indicative of dysregulation of this homeostatic pool that may be a relevant component of the antimalarial activity of this compound class. We propose that use of this technology under various environmental perturbations in P. falciparum can yield quantitative insights into fundamental heme biology.

Keywords: Plasmodium falciparum; genetically encoded biosensor; heme; heme sensor; malaria.


Conflict of interest statement

The authors declare no conflict of interest.

Figures

Fig. 1.
Fig. 1.
Design and characterization of the initial heme biosensor. (A) Schematic of CHY heme sensor and CSY nonsensing control. (B) Representative difference absorption spectrum of the CHY during titration with heme. (C) Heme-binding isotherms based on ∆A416nm Soret peak absorbance for CHY (blue circles), CSY (red triangles), ECFP (cyan inverted triangles), and EYFP (yellow diamonds). The solid line indicates the best fit for the CHY data using a single-site binding model and accounting for ligand depletion. (D) Normalized fluorescence intensity spectra for CHY titrated with heme. (E) Normalized EDA for CHY (blue circles) and CSY (red triangles) fitted to a single-exponential decay model (blue solid line) and a line (red dashed line), respectively. (F) Dependence of ECFP fluorescence lifetime on heme concentration for the CHY (blue circles), CH (green squares), ECFP (cyan inverted triangles), and CSY (red triangles) constructs.
Fig. S1.
Fig. S1.
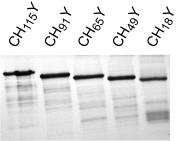
SDS/PAGE purity analysis of recombinant CHY, CSY, ECFP, EYFP, and CH used for fluorescence lifetime spectroscopy.
Fig. S2.
Fig. S2.
Diagram of the fluorescence lifetime instrumentation setup.
Fig. 2.
Fig. 2.
Optimization to improve heme biosensor dynamic range. (A) Schematic of the minilibrary of PfHRP2 fragments (shown in blue) evaluated for improved energy transfer properties. The fragment length (in amino acids) and the amino acid coordinates for mapping each fragment onto full-length PfHRP2 are indicated. Apparent dissociation constants (KD,app) are also shown. (B) Heme-binding stoichiometry varies linearly with length of the PfHRP2-derived heme-binding domain. (C) Dependence of ∆EDA [=EDA (no heme) – EDA (saturating heme)] on length of the PfHRP2-derived heme-binding domain. (D) EDA dependence on heme concentration for optimized CH49Y (blue hollow circles) relative to the original sensor CHY (filled blue circles) and CSY (red triangles). (E) Calibration curve relating normalized EDACH49Y to heme concentration (Materials and Methods).
Fig. S3.
Fig. S3.
SDS/PAGE purity analysis of recombinant minilibrary of truncated biosensors.
Fig. S4.
Fig. S4.
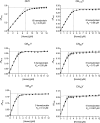
Heme-binding titrations of truncated sensor minilibrary showing heme-binding stoichiometry and apparent heme-binding affinity.
Fig. S5.
Fig. S5.
Heme-dependent changes in donor–acceptor energy transfer efficiency for the minilibrary of truncated sensors.
Fig. S6.
Fig. S6.
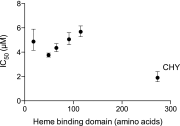
Effect of truncating the heme-binding domain on sensitivity (IC50) of the resulting biosensor. Generally, shorter heme-binding domains result in sensors with lower sensitivity (higher IC50). CH49Y was the most sensitive of the truncated biosensor family with the second-largest dynamic range (after CH18Y) and was therefore chosen as the optimal biosensor design.
Fig. S7.
Fig. S7.
Referencing EDA data for the CH49Y sensor to the CSY control corrects for potentially confounding effects of environmental interfering substances (such as chloride ions) on the spectral characteristics of the fluorescent proteins making up the sensor. Chloride alters the absorption spectrum (A), and the fluorescence spectrum and inherent FRET exhibited by the apo-CH49Y heme sensor (B). (C) The ratio of EDA(CH49Y) to EDA(CSY) eliminates the effects of chloride on the spectral properties of the heme sensor and facilitates accurate chloride-independent quantitation of heme over a broad concentration range.
Fig. 3.
Fig. 3.
Encapsulation of sensor protein library into giant multilamellar vesicles (GMVs) to establish correlation between donor–acceptor energy transfer determined by fluorimetry versus microscopy. (A) Representative images of CH49Y, CSY, ECFP, EYFP, and ECFP+EYFP encapsulated in GMVs illustrate relative brightness in each fluorescence channel. (B) Distributions of EDA for GMVs containing apo-CH49Y (blue solid line) and CSY (red dashed line). (C) EDA for the sensor library described in Fig. 2A determined by microscopy are plotted against those determined by fluorimetry. Error bars represent 95% CIs.
Fig. 4.
Fig. 4.
Using genetically encoded heme sensor to measure cytosolic labile heme concentrations in P. falciparum. (A) Representative images of CH49Y, CSY, ECFP, EYFP, and ECFP+EYFP in trophozoite-stage P. falciparum parasites. (B) Anti-GFP Western blot of lysates obtained from trophozoite-stage parasites expressing CH49Y, CSY, and YFP. (C) Representative EDA distributions for P. falciparum trophozoites expressing CH49Y (solid line) and CSY (dashed line). Using the calibration curve in Fig. 2E yields an average cytosolic labile heme concentration of 1.6 µM (95% CI: 1.56–1.61 µM) across 15 independent experiments. (D) Quantitation of cytosolic labile heme over the P. falciparum IDC. Representative images of Giemsa-stained parasites to confirm the parasite stage being analyzed are shown for each time point. Measurements of CH49Y and CSY lines were made in triplicate, resulting in nine ratio calculations as described in Materials and Methods. Error bars represent 95% CIs.
Fig. S8.
Fig. S8.
Analysis of CH49Y sensor and CSY control expression in trophozoite-stage P. falciparum by flow cytometry. The transgenic parasite pools (blue line) showed positive fluorescence over background (black) in the Pacific Blue (CFP only), AmCyan (CFP and FRET), and FITC (YFP) channels. Clonal parasites used in subsequent experiments (red) exhibited homogenous expression of the respective fluorophores.
Fig. 5.
Fig. 5.
Quantifying the impact of chloroquine on cytosolic labile heme pool in P. falciparum. (A) Growth inhibition data comparing the sensitivity of parasites expressing CH49Y (blue) and CSY (red) to chloroquine. (B) Fold change in labile heme concentration at various chloroquine concentrations after 24-h exposures. Data are representative of three independent experiments. Error bars show 95% CI. (C) Cytosolic labile heme concentrations in parasites that were untreated or exposed to chloroquine (60 nM) or pyrimethamine (125 and 500 nM) for 32 h. Data are representative of three independent experiments. Error bars represent 95% CIs derived from bootstrapping calculations (Materials and Methods).
Fig. S9.
Fig. S9.
Analysis of the impact of chloroquine on the detection of heme by the CH49Y sensor. CH49Y (0.5 µM) and CSY were preequilibrated in parallel with heme (5 µM) and chloroquine levels titrated (0–50 µM) while determining apparent decreases in heme concentration using normalized EDA measurements. Chloroquine gradually reduces the level of detectable heme, until a plateau is reached at ∼1:1 chloroquine:heme stoichiometry. Addition of chloroquine to 10-fold excess over heme does not further reduce the detectable level of heme beyond 50–60% of the actual concentration.

References

    1. Girvan HM, Munro AW. Heme sensor proteins. J Biol Chem. 2013;288(19):13194–13203. - PMC - PubMed
    1. Poulos TL. Heme enzyme structure and function. Chem Rev. 2014;114(7):3919–3962. - PMC - PubMed
    1. Khan AA, Quigley JG. Control of intracellular heme levels: Heme transporters and heme oxygenases. Biochim Biophys Acta. 2011;1813(5):668–682. - PMC - PubMed
    1. Ziegler J, Linck R, Wright DW. Heme aggregation inhibitors: Antimalarial drugs targeting an essential biomineralization process. Curr Med Chem. 2001;8(2):171–189. - PubMed
    1. Pluth MD, Tomat E, Lippard SJ. Biochemistry of mobile zinc and nitric oxide revealed by fluorescent sensors. Annu Rev Biochem. 2011;80:333–355. - PMC - PubMed

Publication types

MeSH terms

LinkOut - more resources