. 2017 Mar 14;114(11):2946-2951.
doi: 10.1073/pnas.1617394114. Epub 2017 Feb 27.

Human-started wildfires expand the fire niche across the United States

Affiliations

Human-started wildfires expand the fire niche across the United States

Jennifer K Balch et al. Proc Natl Acad Sci U S A. .

Abstract

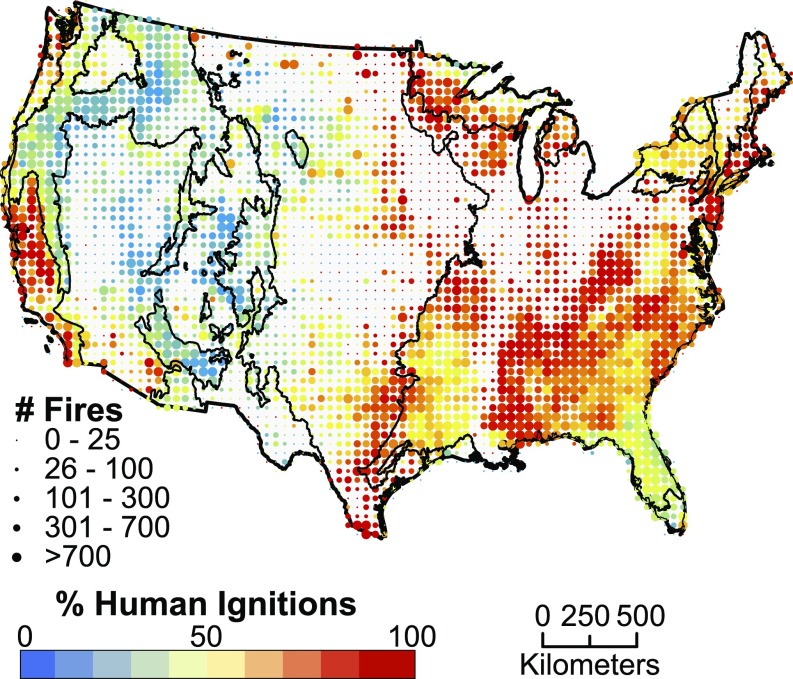
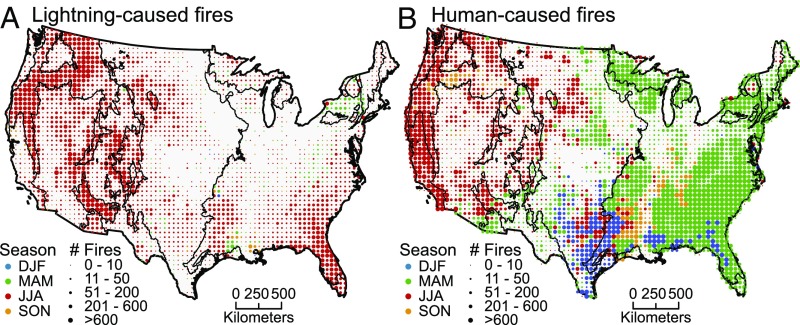
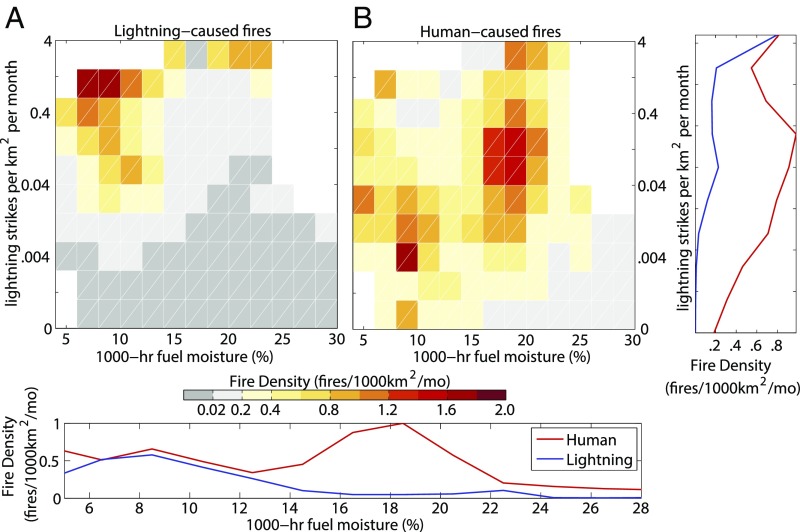
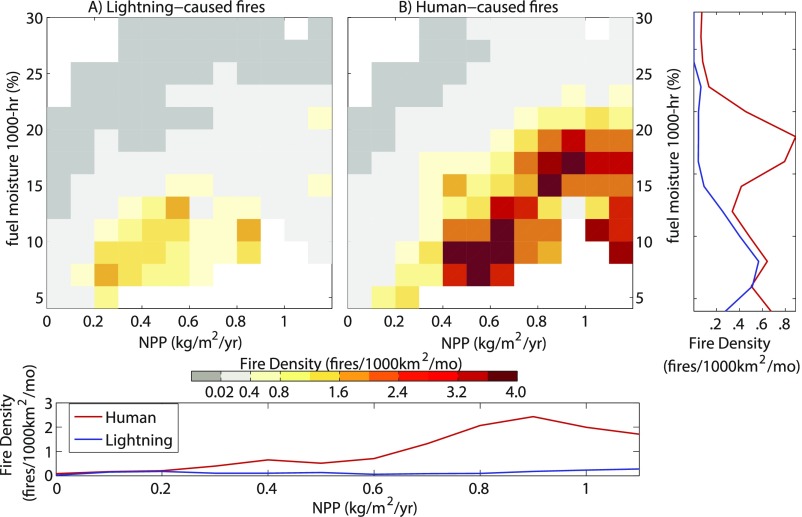
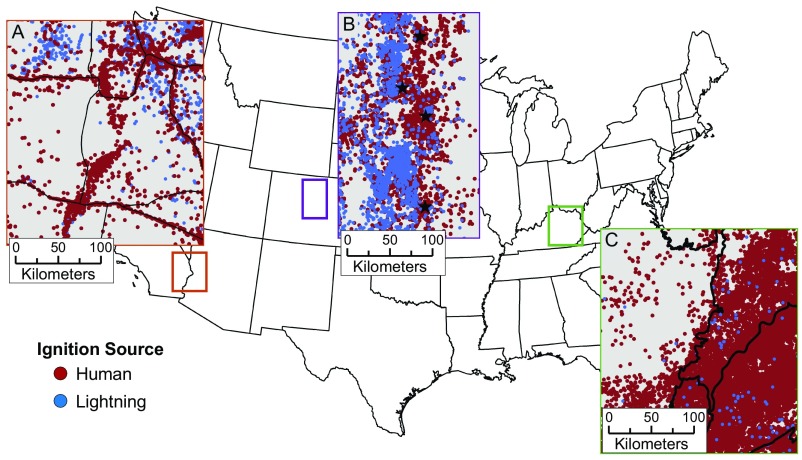
The economic and ecological costs of wildfire in the United States have risen substantially in recent decades. Although climate change has likely enabled a portion of the increase in wildfire activity, the direct role of people in increasing wildfire activity has been largely overlooked. We evaluate over 1.5 million government records of wildfires that had to be extinguished or managed by state or federal agencies from 1992 to 2012, and examined geographic and seasonal extents of human-ignited wildfires relative to lightning-ignited wildfires. Humans have vastly expanded the spatial and seasonal "fire niche" in the coterminous United States, accounting for 84% of all wildfires and 44% of total area burned. During the 21-y time period, the human-caused fire season was three times longer than the lightning-caused fire season and added an average of 40,000 wildfires per year across the United States. Human-started wildfires disproportionally occurred where fuel moisture was higher than lightning-started fires, thereby helping expand the geographic and seasonal niche of wildfire. Human-started wildfires were dominant (>80% of ignitions) in over 5.1 million km2, the vast majority of the United States, whereas lightning-started fires were dominant in only 0.7 million km2, primarily in sparsely populated areas of the mountainous western United States. Ignitions caused by human activities are a substantial driver of overall fire risk to ecosystems and economies. Actions to raise awareness and increase management in regions prone to human-started wildfires should be a focus of United States policy to reduce fire risk and associated hazards.

Keywords: anthropogenic wildfires; fire starts; ignitions; modern fire regimes; wildfire causes.


Conflict of interest statement

The authors declare no conflict of interest.

Figures

Fig. 1.
Fig. 1.
The total number of wildfires (dot size) and the proportion started by humans (dot color: red indicating greater number of human started fires) within each 50 km × 50-km grid cell across the coterminous United States from 1992 to 2012. Black lines are ecoregion boundaries, as defined in the text.
Fig. 2.
Fig. 2.
Frequency distributions of human and lightning-caused wildfires by Julian day of year. (A) Frequency distribution of wildfires across the coterminous United States from 1992 to 2012 (n = 1.5 million); (B) map of United States ecoregions; (C) frequency distributions of wildfires by ecoregions, ordered by decreasing human dominance.
Fig. 3.
Fig. 3.
Comparison of seasonality for (A) lightning- vs. (B) human-ignited wildfires. Human ignitions expand the seasonal fire niche considerably into spring and fall months. Colors show the season with the maximum ignitions caused by lightning and human within each 50 km × 50-km grid cell. Size of dot indicates the number of unique lightning and human fires between 1992 and 2012. Ecoregion boundaries are overlaid for visualization.
Fig. 4.
Fig. 4.
Human vs. lightning fire niche relative to fuel moisture and lightning density, with greatest resulting wildfire density represented by dark red. (A) Lightning-started fires occur in areas with high lightning-strike density and dry fuels. (B) Human-started wildfires expand the fire niche to include areas with low lightning-strike density as well as areas with higher fuel moisture. Graphs on the bottom and far right show histograms of 1,000-h dead fuel moisture and lightning strikes, respectively, for human- and lightning-started fires.
Fig. S1.
Fig. S1.
Human vs. lightning fire niche relative to NPP and fuel moisture, with greatest resulting fire density represented by dark red. (A) Lightning fires occur in areas with moderate NPP and dry fuels. (B) Human fires expand the fire niche to include areas with high NPP as well as areas with higher fuel moisture. Graphs on the bottom and far right show histograms of NPP and 1,000-h dead fuel moisture, respectively, for human- and lightning-started fires.
Fig. S2.
Fig. S2.
Human vs. lightning fire niche relative to NPP and lightning density, with greatest resulting fire density represented by dark red. (A) Lightning fires occur in areas with high lightning-strike density. (B) Human fires expand the fire niche to include areas with low lightning-strike density as well as areas with high NPP. Graphs on the bottom and far right show histograms of NPP and lightning strikes, respectively, for human- and lightning-started fires.
Fig. 5.
Fig. 5.
Trends in the number of large wildfires verified by MTBS records from 1992 to 2012 for lightning-started fires (A–C) vs. human-started fires (D–F) in the spring (green: A and D), summer (red: B and E), and fall (orange: C and F). Where trend lines are shown, Theil-Sen estimated slopes are significantly different from zero (P < 0.05).
Fig. S3.
Fig. S3.
Both human- (red) and lightning- (blue) caused large wildfires show significant increasing trends over the 21-y time series. Data are based on 8,455 fires in the MTBS record.
Fig. S4.
Fig. S4.
Temporal trends in large, MTBS fires for lightning- (A) and human- (B) caused wildfires by ecoregion. Red ecoregions have significant increasing trends, blue ecoregions have significant decreasing trends, and gray ecoregions have no significant trend or insufficient data for analysis. Scatter plots show number of fires per year and plots with trend lines denote a significant slope based on Theil-Sen analysis.
Fig. S5.
Fig. S5.
Visualization of how spatial patterns of human ignitions (red dots) vary across the United States. (A) In the southwest, human ignitions extend linearly along major highways (black lines) and into agricultural areas. (B) Urban development along the Colorado Front Range is a source of many fires in the wildland–urban interface. Stars indicate (from north) the cities of Fort Collins, Boulder, Denver, and Colorado Springs. (C) Human-caused fires increase substantially as ecosystems transition from the agriculture-dominated Interior Plateau in western Kentucky to Appalachian forest in eastern Kentucky (black lines are ecological region level III boundaries).

References

    1. NIFC 2015 Total Wildland Fires and Acres (1960–2015) and Current Year-to-Date by State. National Interagency Fire Center Statistics. Available at https://www.nifc.gov/. Accessed October 7, 2016.
    1. Bowman DM, et al. The human dimension of fire regimes on Earth. J Biogeogr. 2011;38(12):2223–2236. - PMC - PubMed
    1. Bowman DMJS, et al. Fire in the Earth system. Science. 2009;324(5926):481–484. - PubMed
    1. Stephens SL, et al. Land use. Managing forests and fire in changing climates. Science. 2013;342(6154):41–42. - PubMed
    1. Abatzoglou JT, Williams AP. Impact of anthropogenic climate change on wildfire across western US forests. Proc Natl Acad Sci USA. 2016;113(42):11770–11775. - PMC - PubMed

Publication types