. 2017 Mar 22;37(12):3402-3412.
doi: 10.1523/JNEUROSCI.3302-16.2017. Epub 2017 Feb 27.

Development of the Cerebral Cortex across Adolescence: A Multisample Study of Inter-Related Longitudinal Changes in Cortical Volume, Surface Area, and Thickness

Affiliations

Development of the Cerebral Cortex across Adolescence: A Multisample Study of Inter-Related Longitudinal Changes in Cortical Volume, Surface Area, and Thickness

Christian K Tamnes et al. J Neurosci. .

Abstract

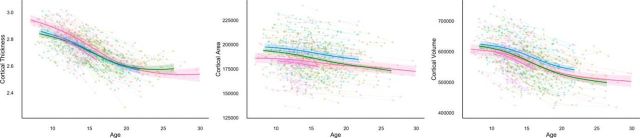
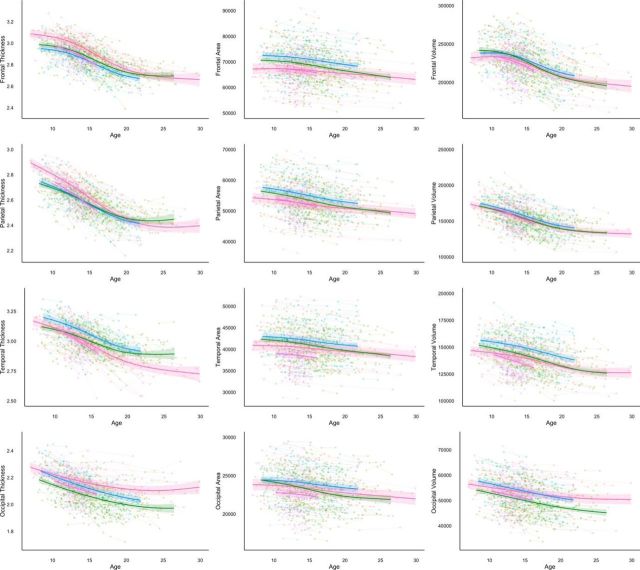
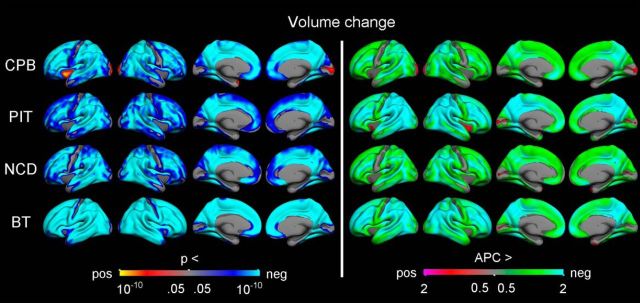
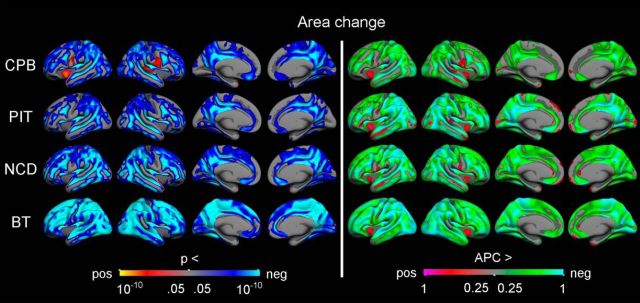
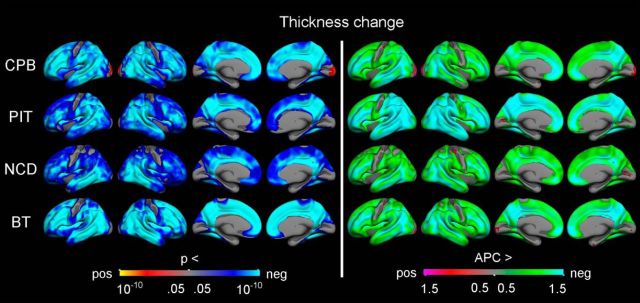
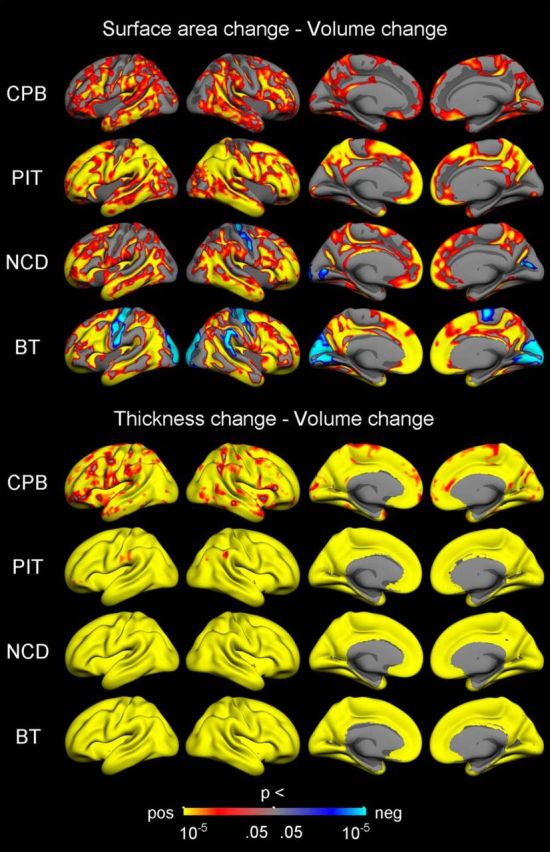
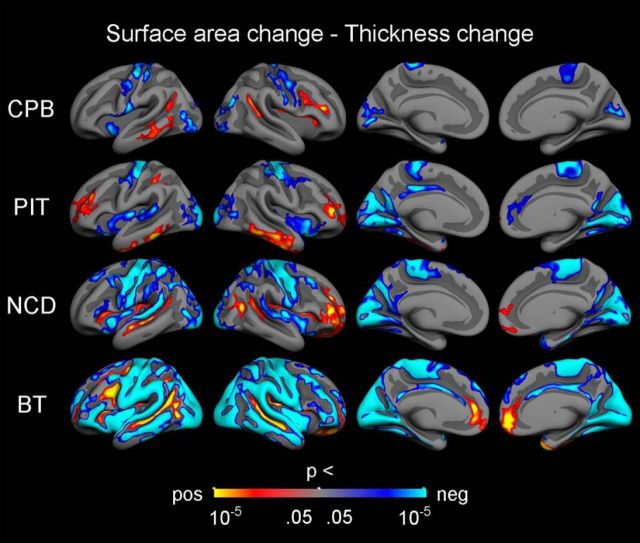
Before we can assess and interpret how developmental changes in human brain structure relate to cognition, affect, and motivation, and how these processes are perturbed in clinical or at-risk populations, we must first precisely understand typical brain development and how changes in different structural components relate to each other. We conducted a multisample magnetic resonance imaging study to investigate the development of cortical volume, surface area, and thickness, as well as their inter-relationships, from late childhood to early adulthood (7-29 years) using four separate longitudinal samples including 388 participants and 854 total scans. These independent datasets were processed and quality-controlled using the same methods, but analyzed separately to study the replicability of the results across sample and image-acquisition characteristics. The results consistently showed widespread and regionally variable nonlinear decreases in cortical volume and thickness and comparably smaller steady decreases in surface area. Further, the dominant contributor to cortical volume reductions during adolescence was thinning. Finally, complex regional and topological patterns of associations between changes in surface area and thickness were observed. Positive relationships were seen in sulcal regions in prefrontal and temporal cortices, while negative relationships were seen mainly in gyral regions in more posterior cortices. Collectively, these results help resolve previous inconsistencies regarding the structural development of the cerebral cortex from childhood to adulthood, and provide novel insight into how changes in the different dimensions of the cortex in this period of life are inter-related.SIGNIFICANCE STATEMENT Different measures of brain anatomy develop differently across adolescence. Their precise trajectories and how they relate to each other throughout development are important to know if we are to fully understand both typical development and disorders involving aberrant brain development. However, our understanding of such trajectories and relationships is still incomplete. To provide accurate characterizations of how different measures of cortical structure develop, we performed an MRI investigation across four independent datasets. The most profound anatomical change in the cortex during adolescence was thinning, with the largest decreases observed in the parietal lobe. There were complex regional patterns of associations between changes in surface area and thickness, with positive relationships seen in sulcal regions in prefrontal and temporal cortices, and negative relationships seen mainly in gyral regions in more posterior cortices.

Keywords: MRI; brain development; gray matter; morphometry; replication.


Figures

Figure 1.
Figure 1.
Developmental trajectories for global cortical measures. Spaghetti plots of mean cortical thickness, total cortical surface area, and total cortical volume, controlling for sex. The colored lines represent the GAMM fitting while the lighter colored areas correspond to the 95% confidence intervals. Pink, CPB; purple, PIT; blue, NCD; green, BT.
Figure 2.
Figure 2.
Developmental trajectories for lobar cortical measures. Spaghetti plots of lobar cortical thickness, surface area, and volume, controlling for sex. The colored lines represent the GAMM fitting while the lighter colored areas correspond to the 95% confidence intervals. Pink, CPB; Purple, PIT; blue, NCD; green, BT.
Figure 3.
Figure 3.
Longitudinal change in cortical volume. GLMs were used to test the statistical significance of APC in volume across the brain surface in each sample, with sex and mean age included as covariates. The results were corrected for multiple comparisons using cluster-size inference. Left, Uncorrected p values within the corrected significant clusters. Right, Rates of change.
Figure 4.
Figure 4.
Longitudinal change in cortical surface area. GLMs were used to test the statistical significance of APC in area across the brain surface in each sample, with sex and mean age included as covariates. The results were corrected for multiple comparisons using cluster-size inference. Left, Uncorrected p values within the corrected significant clusters. Right, Rates of change.
Figure 5.
Figure 5.
Longitudinal change in cortical thickness. GLMs were used to test the statistical significance of APC in thickness across the brain surface in each sample, with sex and mean age included as covariates. The results were corrected for multiple comparisons using cluster-size inference. Left, Uncorrected p values within the corrected significant clusters. Right, Rates of change.
Figure 6.
Figure 6.
Relationships between change in surface area and thickness and change in volume. Vertex-wise p value maps from GLMs testing the relationships between symmetrized APC in different cortical measures, with sex and mean age included as covariates. The results were corrected for multiple comparisons using cluster-size inference. Uncorrected p values within the corrected significant clusters are shown. Red–yellow reflects a positive relationship, where a relatively large decrease in one measure is associated with a relatively large decrease in the other measure. Blue–cyan reflects a negative relationship, in which a relatively large decrease on one measure is associated with a relatively small decrease or increase on the other measure.
Figure 7.
Figure 7.
Relationships between change in surface area and change in thickness. Vertex-wise p value maps from GLMs testing the relationships between symmetrized APC in different cortical measures, with sex and mean age included as covariates. The results were corrected for multiple comparisons using cluster-size inference. Uncorrected p values within the corrected significant clusters are shown. Red–yellow reflects a positive relationship, where a relatively large decrease in one measure is associated with a relatively large decrease in the other measure. Blue–cyan reflects a negative relationship, in which a relatively large decrease on one measure is associated with a relatively small decrease or increase on the other measure.

References

    1. Alemán-Gómez Y, Janssen J, Schnack H, Balaban E, Pina-Camacho L, Alfaro-Almagro F, Castro-Fornieles J, Otero S, Baeza I, Moreno D, Bargalló N, Parellada M, Arango C, Desco M (2013) The human cerebral cortex flattens during adolescence. J Neurosci 33:15004–15010. 10.1523/JNEUROSCI.1459-13.2013 - DOI - PMC - PubMed
    1. Alexander-Bloch AF, Reiss PT, Rapoport J, McAdams H, Giedd JN, Bullmore ET, Gogtay N (2014) Abnormal cortical growth in schizophrenia targets normative modules of synchronized development. Biol Psychiatry 76:438–446. 10.1016/j.biopsych.2014.02.010 - DOI - PMC - PubMed
    1. Alexander-Bloch A, Clasen L, Stockman M, Ronan L, Lalonde F, Giedd J, Raznahan A (2016) Subtle in-scanner motion biases automated measurement of brain anatomy from in vivo MRI. Hum Brain Mapp 37:2385–2397. 10.1002/hbm.23180 - DOI - PMC - PubMed
    1. Amlien IK, Fjell AM, Tamnes CK, Grydeland H, Krogsrud SK, Chaplin TA, Rosa MG, Walhovd KB (2016) Organizing principles of human cortical development-thickness and area from 4 to 30 years: insights from comparative primate neuroanatomy. Cereb Cortex 26:257–267. 10.1093/cercor/bhu214 - DOI - PubMed
    1. Aubert-Broche B, Fonov VS, García-Lorenzo D, Mouiha A, Guizard N, Coupé P, Eskildsen SF, Collins DL (2013) A new method for structural volume analysis of longitudinal brain MRI data and its application in studying the growth trajectories of anatomical brain structures in childhood. Neuroimage 82:393–402. 10.1016/j.neuroimage.2013.05.065 - DOI - PubMed

Publication types