. 2018 Jun;23(6):1453-1465.
doi: 10.1038/mp.2016.260. Epub 2017 Feb 28.

Neurons derived from patients with bipolar disorder divide into intrinsically different sub-populations of neurons, predicting the patients' responsiveness to lithium

Affiliations

Neurons derived from patients with bipolar disorder divide into intrinsically different sub-populations of neurons, predicting the patients' responsiveness to lithium

S Stern et al. Mol Psychiatry. 2018 Jun.

Abstract

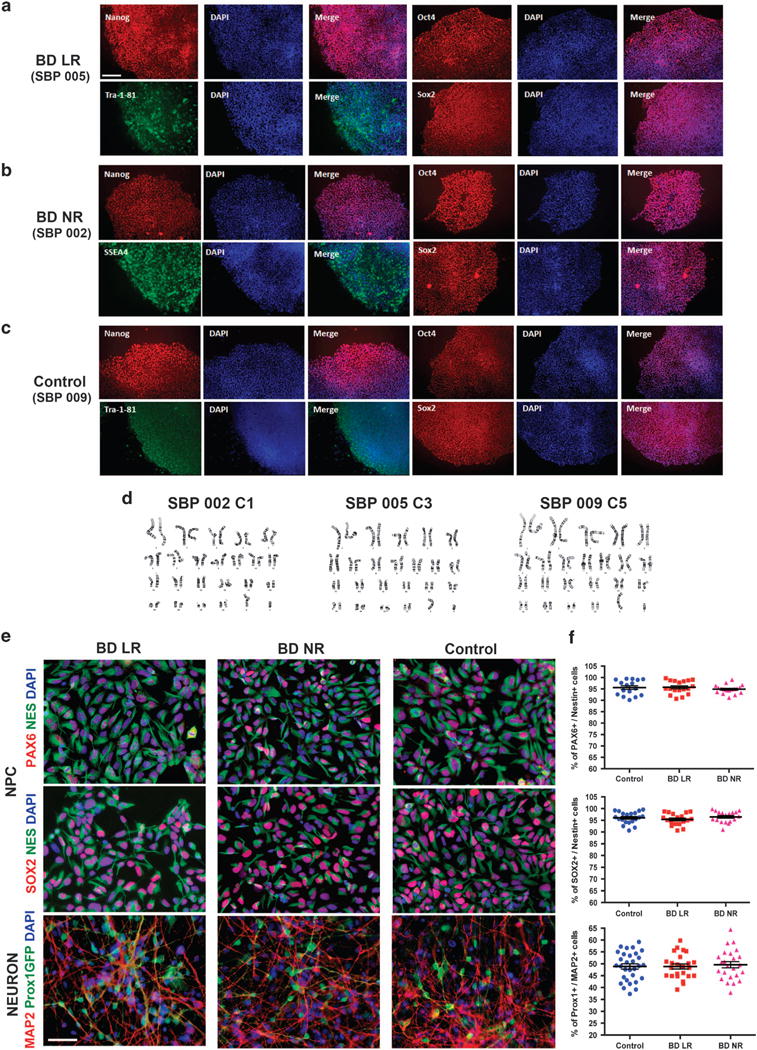
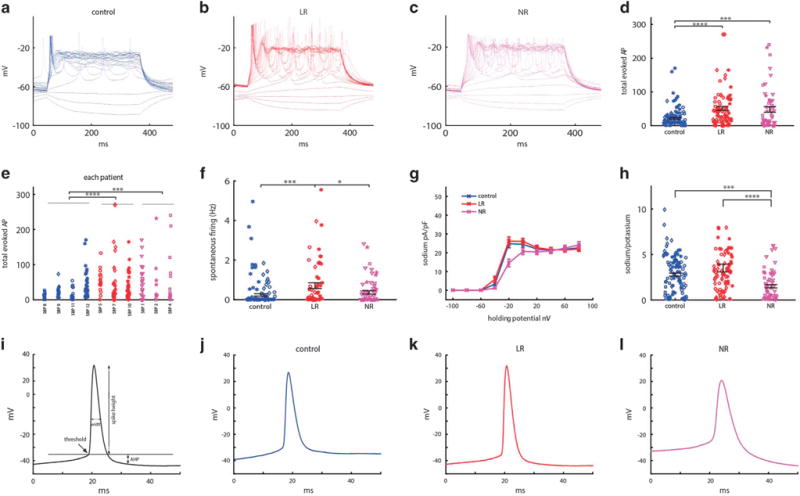
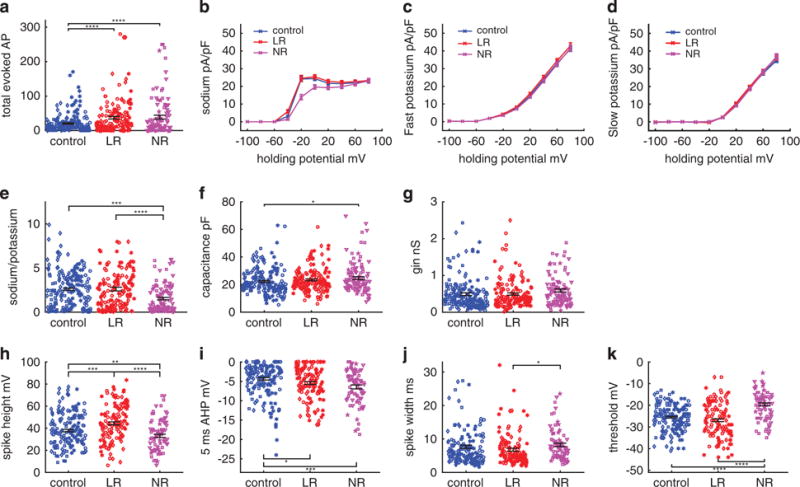
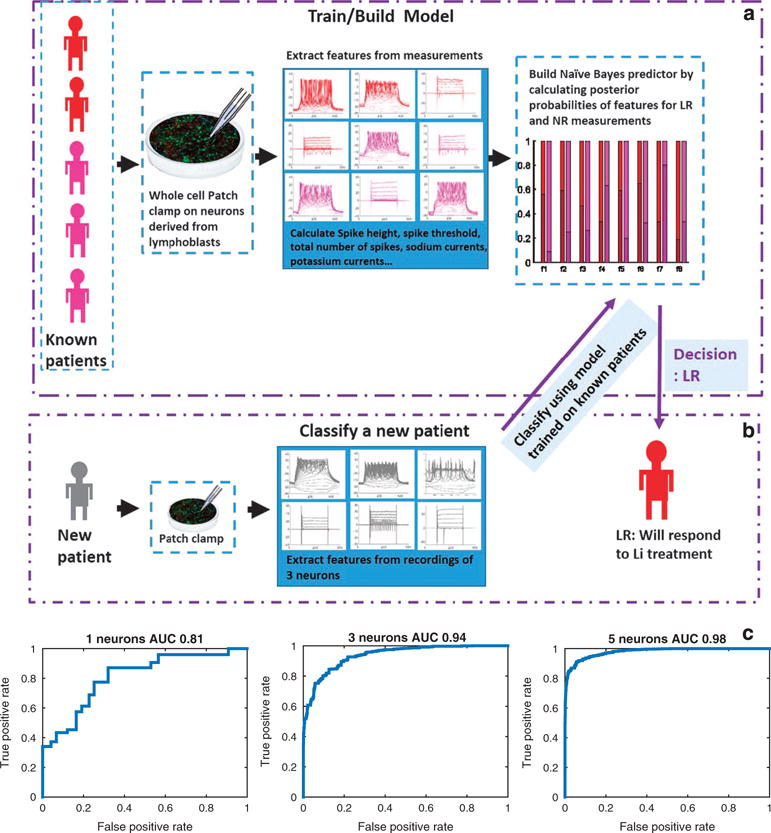
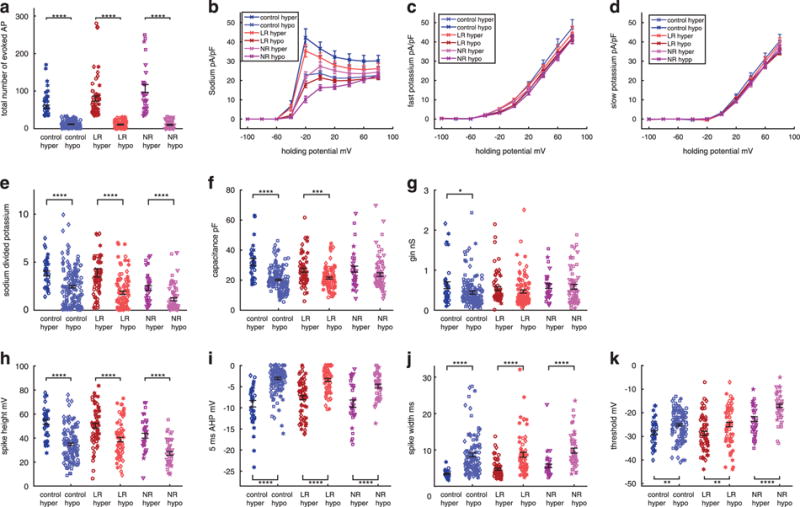
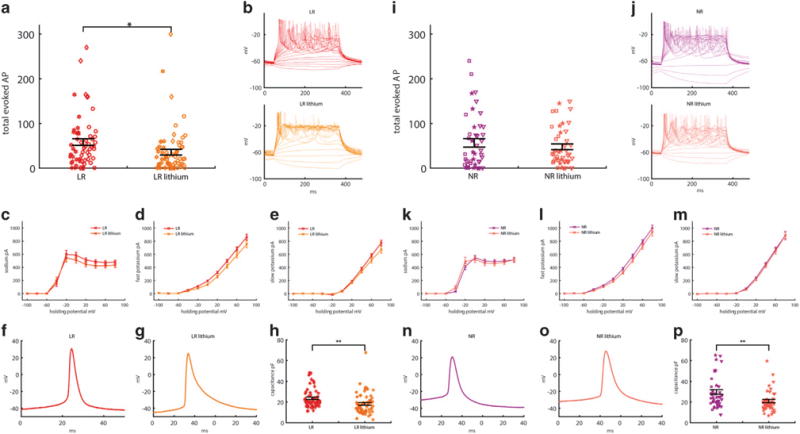
Bipolar disorder (BD) is a progressive psychiatric disorder with more than 3% prevalence worldwide. Affected individuals experience recurrent episodes of depression and mania, disrupting normal life and increasing the risk of suicide greatly. The complexity and genetic heterogeneity of psychiatric disorders have challenged the development of animal and cellular models. We recently reported that hippocampal dentate gyrus (DG) neurons differentiated from induced pluripotent stem cell (iPSC)-derived fibroblasts of BD patients are electrophysiologically hyperexcitable. Here we used iPSCs derived from Epstein-Barr virus-immortalized B-lymphocytes to verify that the hyperexcitability of DG-like neurons is reproduced in this different cohort of patients and cells. Lymphocytes are readily available for research with a large number of banked lines with associated patient clinical description. We used whole-cell patch-clamp recordings of over 460 neurons to characterize neurons derived from control individuals and BD patients. Extensive functional analysis showed that intrinsic cell parameters are very different between the two groups of BD neurons, those derived from lithium (Li)-responsive (LR) patients and those derived from Li-non-responsive (NR) patients, which led us to partition our BD neurons into two sub-populations of cells and suggested two different subdisorders. Training a Naïve Bayes classifier with the electrophysiological features of patients whose responses to Li are known allows for accurate classification with more than 92% success rate for a new patient whose response to Li is unknown. Despite their very different functional profiles, both populations of neurons share a large, fast after-hyperpolarization (AHP). We therefore suggest that the large, fast AHP is a key feature of BD and a main contributor to the fast, sustained spiking abilities of BD neurons. Confirming our previous report with fibroblast-derived DG neurons, chronic Li treatment reduced the hyperexcitability in the lymphoblast-derived LR group but not in the NR group, strengthening the validity and utility of this new human cellular model of BD.


Conflict of interest statement

CONFLICT OF INTEREST

The authors declare no conflict of interest.

Figures

Figure 1
Figure 1
Characterization of induced pluripotent stem cells (iPSCs) and neural cells derived from Epstein–Barr virus-immortalized B-lymphocytes from patients with bipolar disorder (BD). The figure shows representative examples of cells from BD patients who are lithium-responsive (LR), lithium-non-responsive (NR) and neurotypical controls. (a–c) Representative images of iPSC colonies showing expression of pluripotency markers (Nanog, Tra-1-81, Oct4 and Sox2); scale bar: 150 μm. (d) Representative examples of chromosome G-banding analysis of iPSC clones showing normal karyotype. (e) Representative examples of neural progenitor cells (NPCs) expressing typical NPC markers Nestin, Pax6 and Sox2 and examples of neurons expressing the pan neuronal marker MAP2 and the hippocampus dentate gyrus (DG) granular cell marker Prox1. DG cells are evidenced by a vector expressing GFP under the control of a Prox1 promoter (Prox1∷GFP); scale bar: 50 μm. (f) Graph plots showing the percentage of Pax6 or Sox2 over Nestin-positive cells and percentage of Prox1 over Map2-positive cells.
Figure 2
Figure 2
Dentate gyrus granule-cell-like hippocampal neurons derived from patients with bipolar disorder (BD) are hyperexcitable at 3.5 weeks (20–30 days) postdifferentiation when comparing control patients’ neurons (control n = 95 cells from four lines), lithium-responsive (LR) patients (LR n = 84 cells from three lines) and lithium-non-responsive (NR) patients (NR n = 63 cells from three lines), and spike shape is different between the three groups (control, LR and NR). (a–c) Representative recordings of evoked action potentials in current clamp mode of a (a) control (b) LR and (c) NR neuron. (d) Total number of evoked action potentials in 35 depolarization steps shows hyperexcitability of BD neurons. (e) Patient-by-patient plot of the total evoked action potentials. (f) Spontaneous action potential rate measured when the cell is typically held between −45 and −50 mV for 60 s. (g) Average of normalized sodium currents as a function of membrane holding potential display lower sodium current in NR neurons. (h) Average ratio of sodium current measured at −20 mV and slow potassium current measured at 20 mV display lower ratios of the currents in NR neurons. (i) Demonstration of action potential features. (j–l) Representative trace of an action potential of a control (j), LR (k) and NR neuron (l) displays a different spike shape between the three groups (see Supplementary Figure 1 for averages of the different features). LR neurons have a higher amplitude and narrower action potential compared with control neurons (k), whereas NR neurons have a lower amplitude and broader action potentials, with a more depolarized threshold for evoking an action potential (l). Identical symbols indicate cells from the same cell line. *P<0.05, **P<0.01. ***P<0.001 and ****P<0.0001.
Figure 3
Figure 3
Analysis of electrophysiological recordings from 10–45 days postdifferentiation reveals that the differences between the three groups (control, lithium-responsive (LR) and lithium-non-responsive (NR)) are maintained through the entire differentiation period and are enhanced when using this entire data set. Neurons are recorded over 10–45 days postdifferentiation (control n = 195 neurons from four lines, LR n = 155 neurons from three lines and NR n = 112 neurons from three lines). (a) Total number of evoked action potentials displays hyperexcitability in bipolar disorder neurons. (b–e) Averages of (b) sodium currents, (c) fast potassium currents, (c) slow potassium currents and (e) the ratio of sodium at − 20 mV to slow potassium currents at 20 mV. A reduction in the sodium currents and the sodium-to-potassium current ratio is observed for NR neurons. (f) Capacitance is increased in NR neurons. (g) Input conductance is similar in the three groups. (h–k) Characterization of spike shape. (h) Spike height is increased in LR neurons and decreased in NR neurons. (i) Five milliseconds after-hyperpolarization (AHP) amplitude is increased in LR neurons and even more in NR neurons. (j) Spike width is broader in NR compared with LR neurons. (k) The threshold for evoking an action potential is more depolarized in NR neurons. Identical symbols indicate cells from the same cell line. *P<0.05, **P<0.01, ***P<0.001 and ****P<0.0001.
Figure 4
Figure 4
Classification of a patient as responsive or non-responsive to lithium (Li) based on electrophysiological measurements. (a) Building the model: The model is trained on five of the six patients. Features such as spike height and spike threshold (see Materials and Methods for the entire list) are extracted from patch-clamp measurements and a Naïve Bayes (NB) model is built using posterior probabilities of the features that are calculated from the data set of the five patients. The model shown in the graph shows the posterior probabilities of each of the features when the patients are lithium (Li)-responsive (LR) patients (shades of red) and Li-non-responsive (NR) patients (shades of purple). (b) To classify a new patient, we use patch-clamp recordings from three cells. The NB model that was trained on measurements of the other patients is used to give a posterior score of the new patient as being NR or LR given the features extracted from its three-cell recordings. The decision is made based on the maximum posterior probability. (c) Performance is assessed pulling together classification of the six patients (each with a model trained on the other five patients) using a receiver-operating characteristics (ROC) curve and the area under the curve (AUC). An ROC curve is shown for performance using one-cell recordings for classification, three-cell recordings or five-cell recordings. With five-cell recordings, the AUC is 0.98.
Figure 5
Figure 5
Analysis of a subset of the data of the most excitable ‘hyper’ neurons (producing more than 35 evoked action potentials, see Materials and Methods) at 10–45 days postdifferentiation (control n = 34 neurons from four lines, lithium-responsive (LR) n = 60 neurons from three lines and lithium-non-responsive (NR) n = 37 neurons from three lines) vs the rest of the ‘hypo’ neurons. Each graph shows six groups with pair comparisons: ‘hyper’ control (dark blue) vs ‘hypo’ control (light blue), ‘hyper’ LR (dark red) vs ‘hypo’ LR (light red), and ‘hyper’ NR (dark purple) vs ‘hypo’ NR (light purple). Supplementary Figure 2 shows the comparisons between the other two subgroups. The first is a comparison between ‘hyper’ control vs ‘hyper’ LR and ‘hyper’ NR. The second is a comparison between the ‘hypo’ control vs ‘hypo’ LR and ‘hypo’ NR. (a) Total number of evoked action potentials is naturally increased in the ‘hyper’ groups. (b–e) Averages of (b) sodium currents, which are increased in the ‘hyper’ groups of control, LR and NR neurons, (c) fast potassium currents, which are increased in the ‘hyper’ groups of control, LR and NR neurons, (d) slow potassium currents (unchanged in ‘hyper’ vs ‘hypo’ neurons) and (e) the ratio of sodium at −20 mV to slow potassium currents at 20 mV, which is increased in the ‘hyper’ control, LR and NR neurons. (f) Capacitance is larger in the ‘hyper’ control and LR neurons. (g) Input conductance is larger in the ‘hyper’ control neurons. (h–k) Characterization of spike shape. (h) Spike height is increased in the ‘hyper’ control, LR and NR neurons. (i) Five milliseconds after-hyperpolarization (AHP) is larger in the ‘hyper’ control, LR and NR neurons. (j) Spike width is narrower in the ‘hyper’ control, LR and NR neurons. (k) Threshold for evoking an action potential is less depolarized in the ‘hyper’ control, LR and NR neurons. Identical symbols indicate cells from the same cell line. *P<0.05, **P<0.01. ***P<0.001 and ****P<0.0001.
Figure 6
Figure 6
Lithium (Li) decreases the excitability of neurons from Li-responsive (LR) patients (n = 59 neurons from three lines, and n = 67 Li-treated neurons from three lines) but not of neurons from lithium-non-responsive (NR) patients (n = 44 neurons from three lines, and n = 47 neurons from three lines treated with Li). Neurons patched at 22–30 days postdifferentiation. (a–h) Effects of Li on LR neurons. Red represents measurements without Li treatment; orange represents measurements with Li treatment. (a) Total number of evoked action potentials. (b) Representative recording of evoked action potentials in current clamp mode in LR (red) and Li-treated LR (orange) neurons (c–e) Averages of (c) sodium currents recorded in voltage clamp mode, decreased with Li treatment, (d) fast potassium currents, decreased with Li treatment and (e) slow potassium currents, unchanged after treatment. (f and g) A representative trace of an action potential shape of an untreated LR neuron (f) and a Li-treated LR neuron. (g) Li treatment causes broadening of the action potential and a reduction in the fast after-hyperpolarization (AHP) amplitude. See Supplementary Figure 3 for averages. (h) Capacitance decreased after Li treatment. (i–p) Similar analysis of the effect of Li on NR neurons (purple) and Li-treated NR neurons (pink) shows there is no significant decrease in neuronal excitability (i and j). (k–m) No significant differences in the sodium and slow potassium current were displayed. The fast potassium current decreased after treatment. (n and o) Li treatment caused a reduction in fast AHP amplitude and a shift towards a less depolarized threshold for evoking an action potential; see Supplementary Figure 3 for averages. (p) Similar to LR neurons, capacitance was reduced with Li treatment in NR neurons. Identical symbols indicate cells from the same cell line. *P<0.05 and **P<0.01.

References

    1. Angst J. The emerging epidemiology of hypomania and bipolar II disorder. J Affect Disord. 1998;50:143–151. - PubMed
    1. Hirschfeld RM, Calabrese JR, Weissman MM, Reed M, Davies MA, Frye MA, et al. Screening for bipolar disorder in the community. J Clin Psychiatry. 2003;64:53–59. - PubMed
    1. Merikangas KR, Akiskal HS, Angst J, Greenberg PE, Hirschfeld RM, Petukhova M, et al. Lifetime and 12-month prevalence of bipolar spectrum disorder in the National Comorbidity Survey replication. Arch Gen Psychiatry. 2007;64:543–552. - PMC - PubMed
    1. Belmaker RH. Bipolar disorder. N Engl J Med. 2004;351:476–486. - PubMed
    1. Judd LL, Akiskal HS, Schettler PJ, Endicott J, Maser J, Solomon DA, et al. The long-term natural history of the weekly symptomatic status of bipolar I disorder. Arch Gen Psychiatry. 2002;59:530–537. - PubMed

Publication types