. 2017 Feb 27;7(1):66.
doi: 10.1038/s41598-017-00115-w.

Epilepsy-associated GRIN2A mutations reduce NMDA receptor trafficking and agonist potency - molecular profiling and functional rescue

Affiliations

Epilepsy-associated GRIN2A mutations reduce NMDA receptor trafficking and agonist potency - molecular profiling and functional rescue

L Addis et al. Sci Rep. .

Abstract

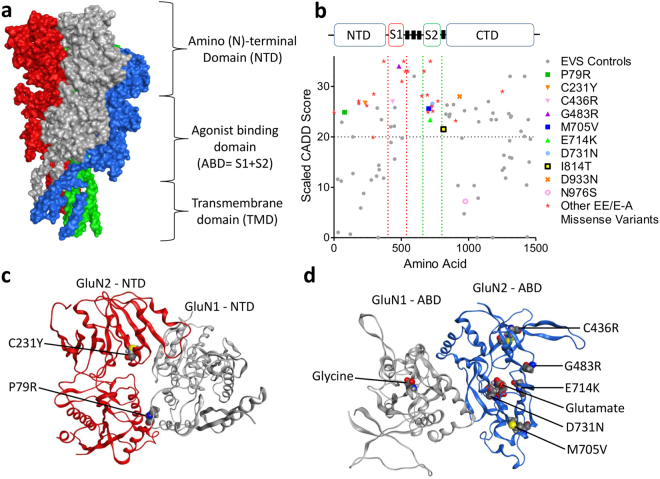
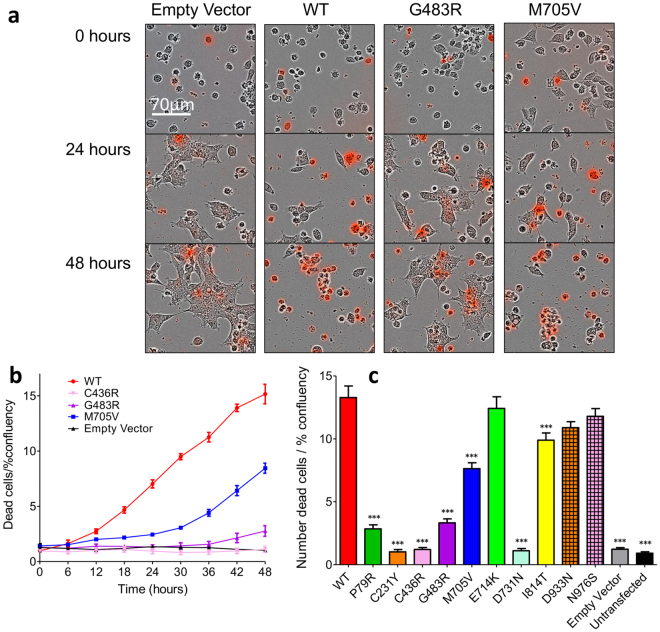
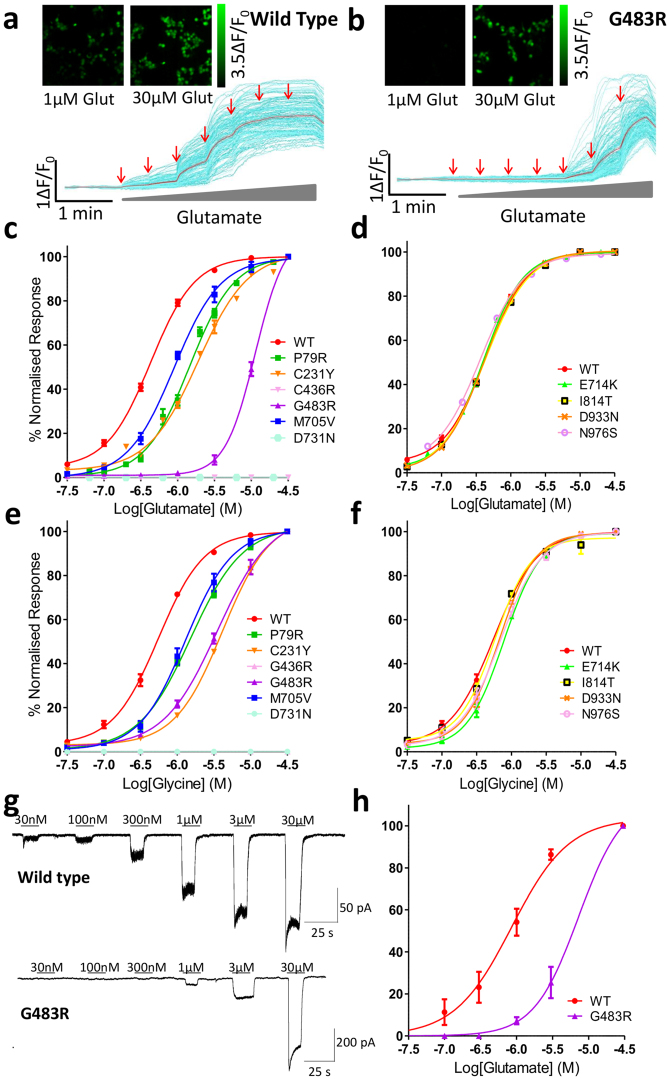
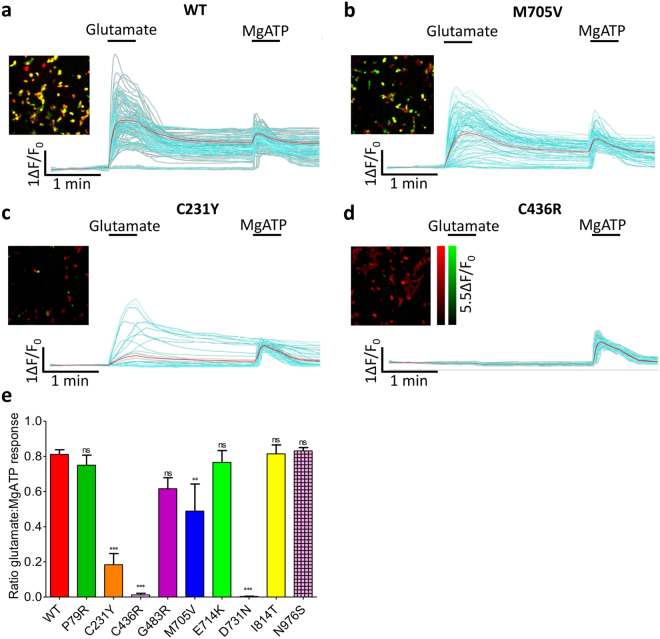
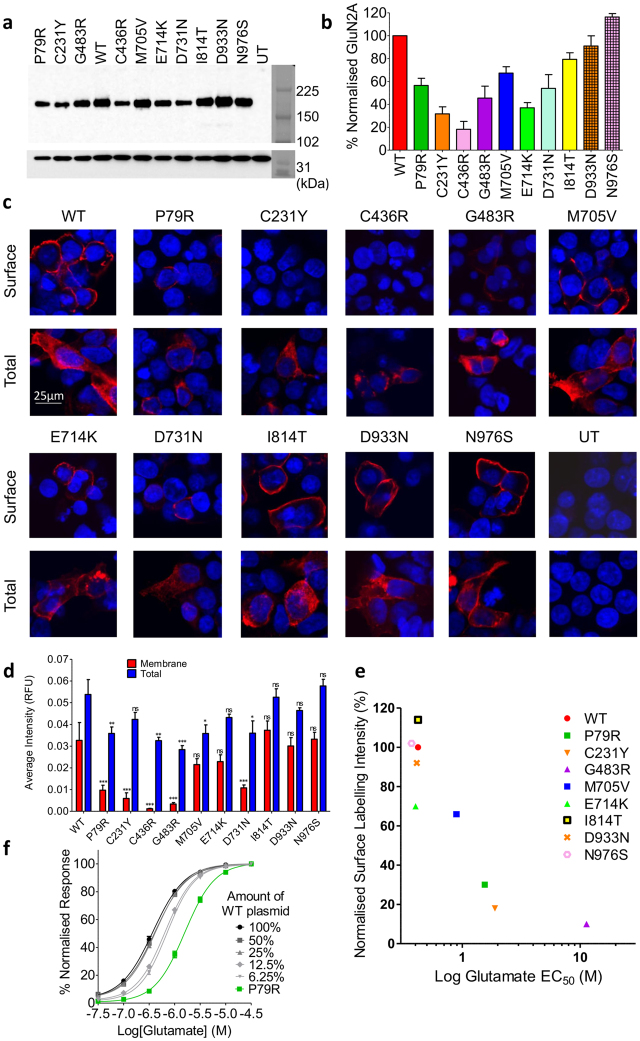
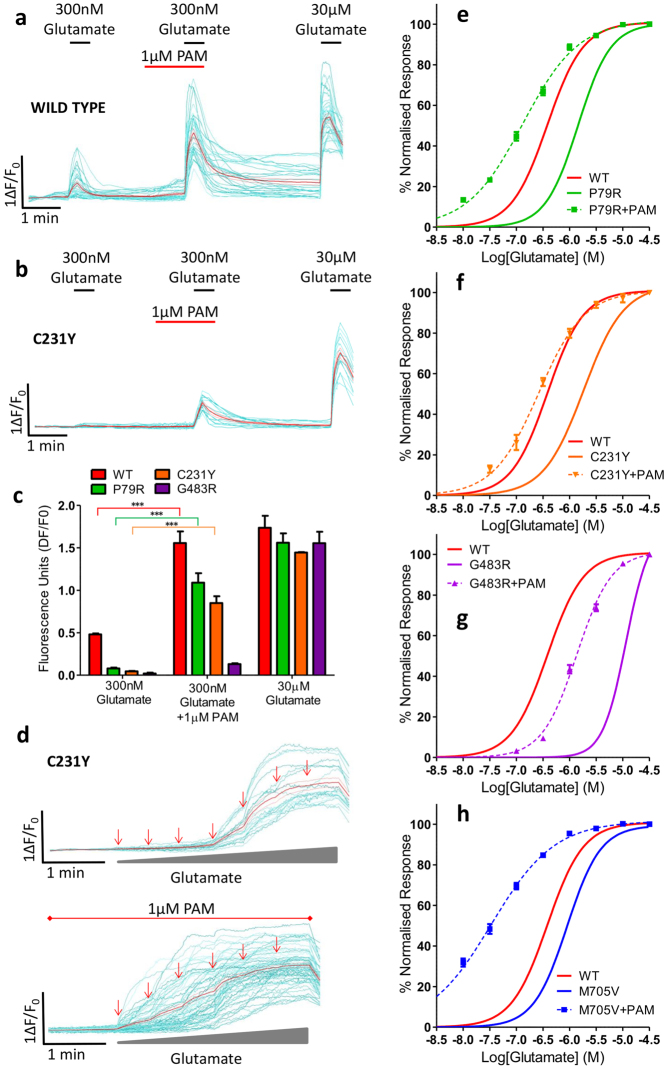
Mutations in the N-methyl-D-aspartate receptor (NMDAR) gene GRIN2A cause epilepsy-aphasia syndrome (EAS), a spectrum of epileptic, cognitive and language disorders. Using bioinformatic and patient data we shortlisted 10 diverse missense mutations for characterisation. We used high-throughput calcium-flux assays and patch clamp recordings of transiently transfected HEK-293 cells for electrophysiological characterization, and Western blotting and confocal imaging to assay expression and surface trafficking. Mutations P79R, C231Y, G483R and M705V caused a significant reduction in glutamate and glycine agonist potency, whilst D731N was non-responsive. These mutants, along with E714K, also showed significantly decreased total protein levels and trafficking to the cell surface, whilst C436R was not trafficked at all. Crucially this reduced surface expression did not cause the reduced agonist response. We were able to rescue the phenotype of P79R, C231Y, G483R and M705V after treatment with a GluN2A-selective positive allosteric modulator. With our methodology we were not able to identify any functional deficits in mutations I814T, D933N and N976S located between the glutamate-binding domain and C-terminus. We show GRIN2A mutations affect the expression and function of the receptor in different ways. Careful molecular profiling of patients will be essential for future effective personalised treatment options.


Conflict of interest statement

The authors declare no competing financial interests.

Figures

Figure 1
Figure 1
CADD scores and protein modelling predict stronger functional effects for EAS-associated GRIN2A mutations than in controls. (a) Protein structure model of NMDAR (PDB ID 4TLL): GluN1 (grey and green), GluN2 (B in this structure) (blue and red). Membrane would be horizontal in this image with the NTD and ABD in the extracellular space. Intracellular C-Terminal domain would be below the transmembrane domain (not present in this structure). (b) Schematic linear representation of GluN2A with the domains annotated. Black rectangles indicate transmembrane domains. Plot of scaled CADD scores against GluN2A amino acid position for missense variants. Black dots represent scores for 65/6474 individuals from the Exome Variant Server (EVS) that had missense variants in GRIN2A and coloured symbols are scores for variants found in individuals with EAS disorders. The horizontal dotted line indicates the scaled CADD score cut off of 20 for a highly likely deleterious variant. (c) Protein structure model of the NTD of NMDAR (PDB ID 3QEL): GluN1 (grey), GluN2 (B in this structure) (red). Mutations considered in this domain highlighted (conserved between GluN2A and B). (d) Protein structure model of the LBD of NMDAR (PDB ID 2A5T): GluN1 (grey), GluN2A (blue). Mutations considered in this paper highlighted, as well as agonists.
Figure 2
Figure 2
Selected GRIN2A mutations protect against glutamate-induced toxicity in HEK cells. (a) Superimposed bright field and pseudocolour red images, indicating fluorescent Cytotox Red dye in dead cells, of HEK cells transiently transfected with various GRIN2A mutant constructs, or empty vector. Free glutamate and glycine in the culture media causes cell death in those expressing functional NMDARs over 48 hours. Images captures at 20x using the IncuCyte live-cell imaging system. (b) Representative time course of cell death, normalised to initial confluency in each well, n = 5 wells, Mean ± SEM. (c) Plot of cell mortality for GRIN2A mutants normalised to initial confluency per well. Mutants P79R, C231Y, C436R, G483R, M705V, D731N and I814T are protective against glutamate toxicity either due to reduced trafficking and/or reduced functionality of the receptors. ***p < 0.001 Dunnett’s corrected one-way ANOVA. Averaged data from n = 15 wells per construct except for G483R, E714K, D933N and N976S where n = 12 wells, 3 × 104 cells/well. Mean ± SEM.
Figure 3
Figure 3
GRIN2A mutations alter the response to glutamate and glycine. (a,b) Pseudocolour images and representative single-cell traces from calcium-flux imaging for HEK cells transfected with either WT or G483R GRIN2A showing different calcium responses caused by the application of increasing concentrations of glutamate (30 nM–30 µM red arrows). Individual cell traces in cyan and the mean response in red. (c,d) Normalised concentration response curves (CRCs) to increasing concentrations of glutamate from single cell calcium-flux imaging. In (c) 4 mutants; P79R, C231Y, C483R and M705V have reduced agonist potency, while C436R and D731N show no response to glutamate. Four mutant constructs (d), show an unaltered response to glutamate. (e,f) Normalised CRCs to increasing glycine concentration with constant 3 µM glutamate – the mutations show similar responses as to glutamate. See Table 2 for n to create averaged data per construct, 3 × 104 cells/well. Error bars ± SEM. (g) Representative continuous voltage-clamp recordings obtained from HEK cells transfected with WT or G483R GRIN2A plasmid. Bars above the recording indicate glutamate application (co-applied with 30 µM glycine). Application of increasing concentrations of glutamate shows a progressive increase in current observed, the sensitivity of which is shifted to higher concentrations of glutamate in the G483R mutant compared to WT. (h) Normalised CRC to glutamate as recorded in (g) indicates the same response as for single cell calcium imaging (n = 3).
Figure 4
Figure 4
GRIN2A mutations alter the number of cells responding to glutamate. (a–d) Each panel contains pseudocolour images of HEK cells transfected with WT or mutant GRIN2A showing co-localisation of responses to application of 100 µM glutamate +30 µM glycine (green - activation of surface-expressing GluN2A receptors) and subsequently 100 µM MgATP (red - activation of endogenous P2Y receptors). Panels also show single-cell traces from the same experiment, indicating the different effects of these agonists on cells transfected with (a) WT, (b) M705V, (c) C231Y or (d) C436R mutants. Individual cell traces displayed in cyan and the mean response shown in red. (e) Ratio of the number of transfected HEK cells responding to 100 µM glutamate +30 µM glycine subsequent to 100 µM MgATP. Dunnett’s corrected one-way ANOVA compared to WT, **p < 0.01, ***p < 0.001, ns = non-significant. Data averaged from n = 12 wells, 3 × 104 cells/well, for each construct over 2 assays. Error bars ± SEM.
Figure 5
Figure 5
GRIN2A mutations reduce total protein levels and membrane trafficking of GluN2A. (a) Representative Western blot of HEK lysates probed with anti-GluN2A antibody (top), and anti-GAPDH (bottom) as a loading control. Bands around 180 kDa indicate GluN2A. WT, wild type, UT – untransfected. Right is Amersham Full-Range rainbow molecular weight marker with the blot imaged in visible light. (b) Plot of amount of GluN2A protein, normalised to WT, from Western blotting of total cell lysates of transiently co-transfected HEK cells 48-hours post transfection. Average of 3 blots from 3 independent transfections. Error bars indicated SEM. (c) Fixed and immunolabelled co-transfected HEK cells with anti-HA antibody (red) to detect surface GluN2A expression, and fixed, permeabilised and immunolabelled with the same antibody to detect total GluN2A protein levels. Scale bar 25 µm. Nuclei stained with Hoechst (blue). (d) Quantitation of surface and total GluN2A protein levels, averaged over the total number of cells analyzed for each condition (n is between 903 to 2255 cells), reveals greatly reduced surface expression of GluN2A as measured by fluorescence intensity. Dunnett’s corrected one-way ANOVA for membrane or total intensity as compared to WT *p < 0.05, **p < 0.01, ***p < 0.001, ns = non-significant. Average ± SEM. (e) Relative surface levels of NMDARs correlated with the log of glutamate EC50 (Pearson’s coefficient of determination r2 = 0.77, two-tailed p = 0.002). (f) Normalised CRC from single-cell calcium-flux imaging. Response to increasing concentrations of glutamate from HEK cells co-transfected with decreasing quantities of WT GRIN2A per well (100% = 320 ng) with standard 320 ng GRIN1 per well. Response is compared to mutant P79R. Error bars ± SEM.
Figure 6
Figure 6
Pharmacological rescue of functional deficits can be achieved for selected GRIN2A mutants. Examples of single-cell imaging of HEK transfected with (a) WT and (b) C231Y mutant showing calcium-influx response to 300 nM glutamate before and after incubation with 1 µM PAM and in comparison to maximal 30 µM glutamate. (c) Graph of single cell imaging data showing response of WT and mutants P79R, C231Y and G483R to 300 nM glutamate with and without 1 µM PAM. Bonferroni corrected ANOVA ***p < 0.001, n = 15 wells (over 3 assays) for each construct, 3 × 104 cells/well. Mean ± SEM. (d) Examples of single cell imaging of HEK transfected with C231Y mutant showing calcium-influx response to increasing concentrations of glutamate (30 nM, 100 nM, 300 nM, 1 µM, 10 µM and 30 µM arrows) top, and below, increasing concentrations of glutamate (30 nM, 100 nM, 300 nM, 1 µM and 30 µM arrows) with constant 1 µM PAM. Individual cell traces displayed in cyan and the mean response shown in red. (e–h) Concentration response curves of mutant (P79R, C231Y, G483R or M705V) GRIN2A transfected in HEK cells to increasing concentrations of glutamate (30 nM to 30 µM) during incubation with 1 µM PAM recorded from single-cell calcium-flux imaging. Each graph shows the response of the WT GRIN2A construct with no PAM in red (curve from Fig. 3c) and the response of the mutant before (solid line) and after (dashed line) the addition of PAM. p < 0.0001 for LogEC50 for each construct + PAM when compared to without PAM addition. Data averaged from n = 12 wells for each construct, 3 × 104 cells/well, (over 3 assays). Error bars ± SEM.

References

    1. Tsai MH, et al. Clinical genetic study of the epilepsy-aphasia spectrum. Epilepsia. 2013;54:280–287. doi: 10.1111/epi.12065. - DOI - PubMed
    1. Rudolf G, Valenti MP, Hirsch E, Szepetowski P. From rolandic epilepsy to continuous spike-and-waves during sleep and Landau-Kleffner syndromes: insights into possible genetic factors. Epilepsia. 2009;50(Suppl 7):25–28. doi: 10.1111/j.1528-1167.2009.02214.x. - DOI - PubMed
    1. Smith AB, Bajomo O, Pal DK. A meta-analysis of literacy and language in children with rolandic epilepsy. Dev. Med. Child Neurol. 2015;57:1019–1026. doi: 10.1111/dmcn.12856. - DOI - PubMed
    1. Guerrini R, Pellacani S. Benign childhood focal epilepsies. Epilepsia. 2012;53(Suppl 4):9–18. doi: 10.1111/j.1528-1167.2012.03609.x. - DOI - PubMed
    1. Hahn A, Pistohl J, Neubauer BA, Stephani U. Atypical “benign” partial epilepsy or pseudo-Lennox syndrome. Part I: symptomatology and long-term prognosis. Neuropediatrics. 2001;32:1–8. doi: 10.1055/s-2001-12216. - DOI - PubMed

Publication types