

Beneficial Effects of Paeoniflorin Enriched Extract on Blood Pressure Variability and Target Organ Damage in Spontaneously Hypertensive Rats
- PMID: 28243310
- PMCID: PMC5294363
- DOI: 10.1155/2017/5816960
Beneficial Effects of Paeoniflorin Enriched Extract on Blood Pressure Variability and Target Organ Damage in Spontaneously Hypertensive Rats
Abstract
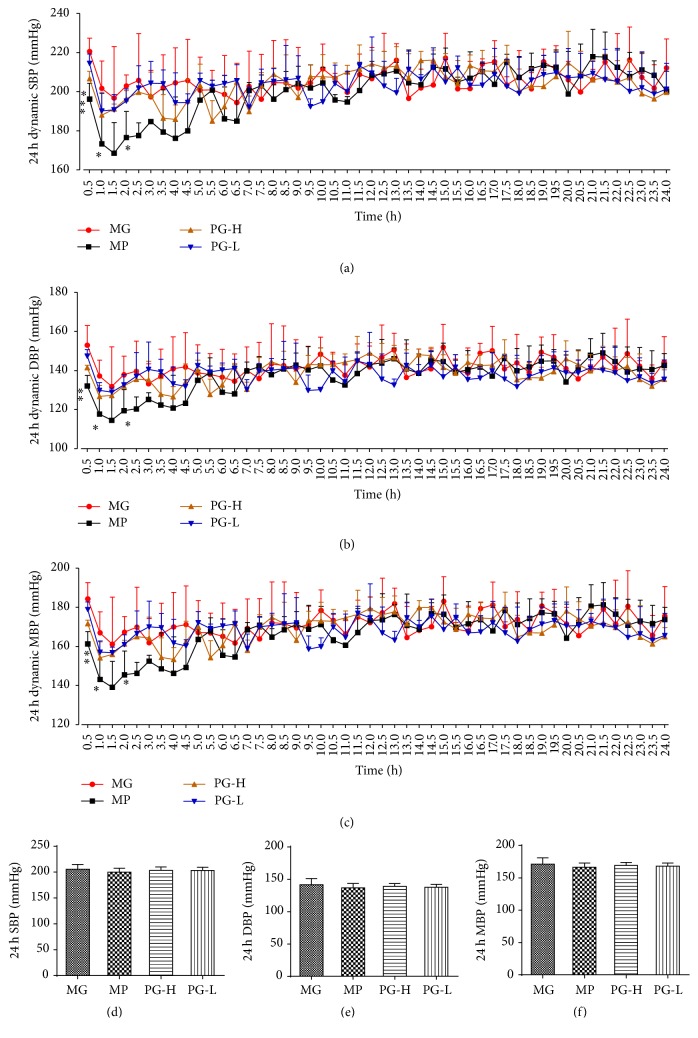
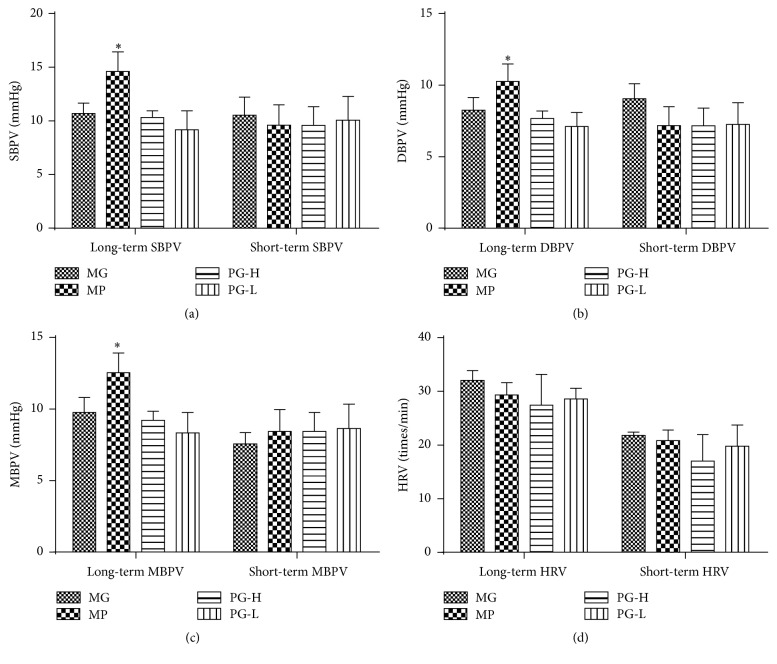
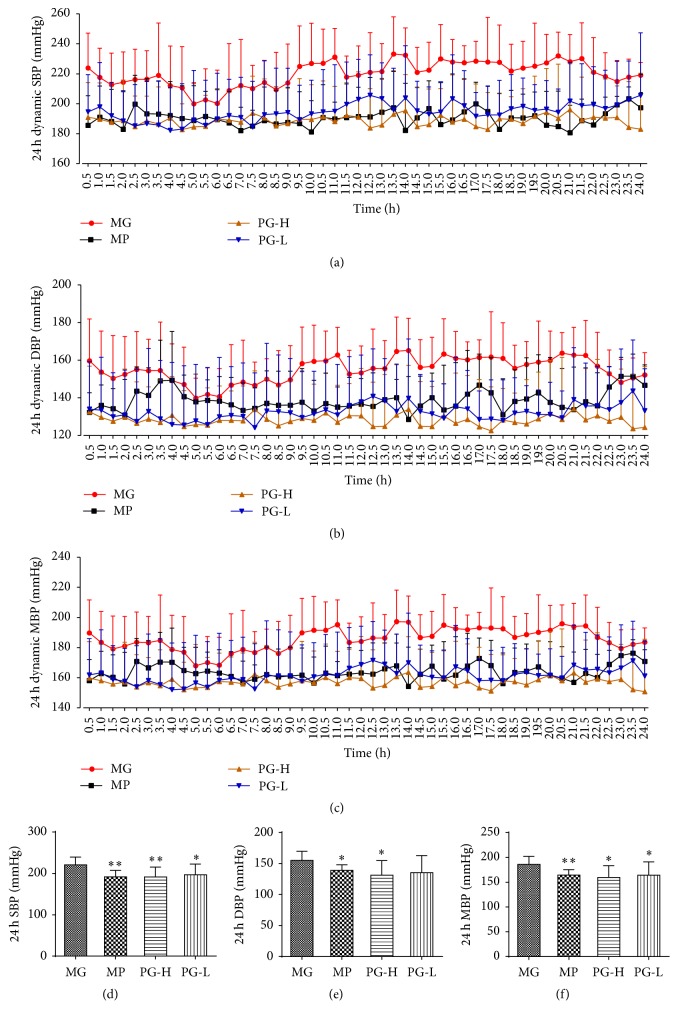
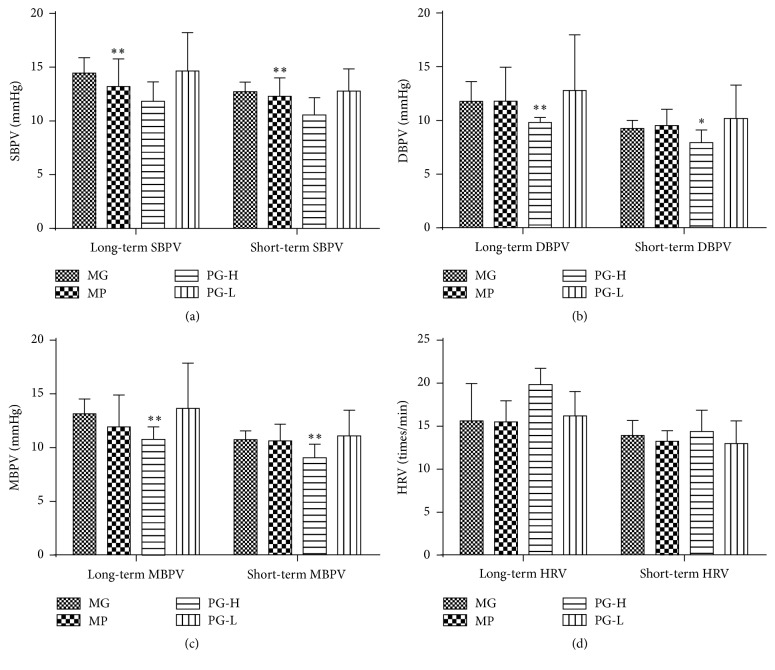
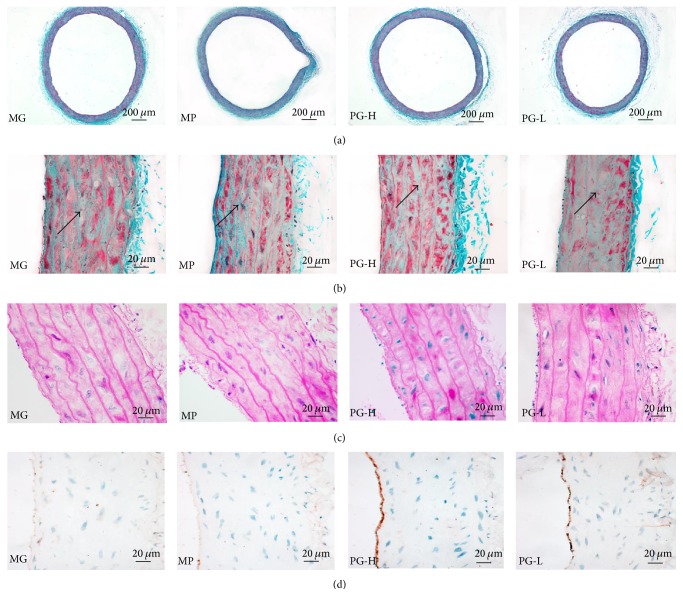
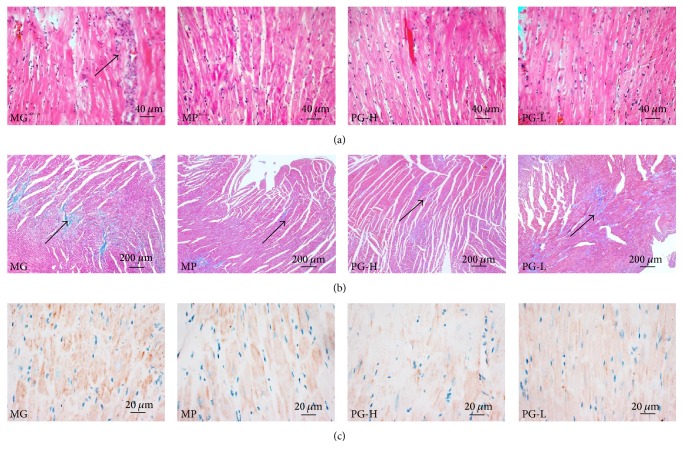
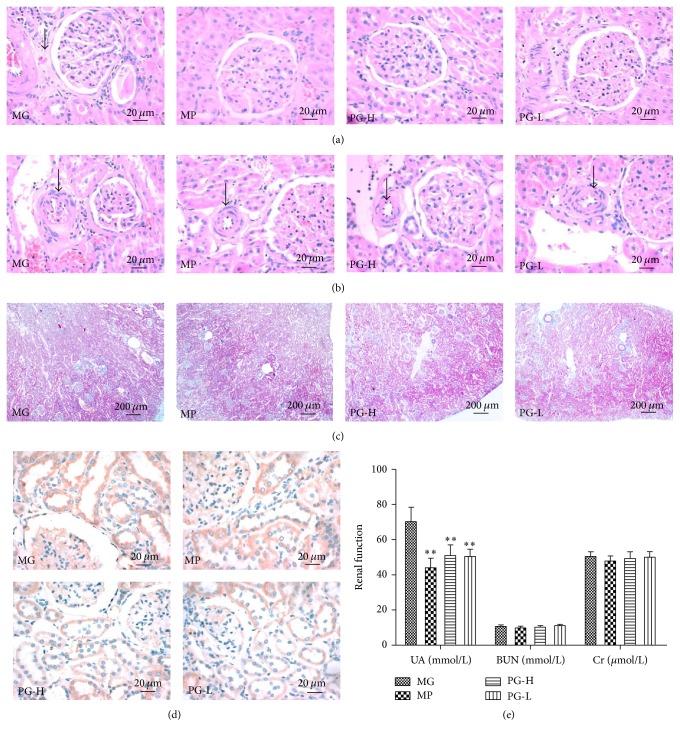
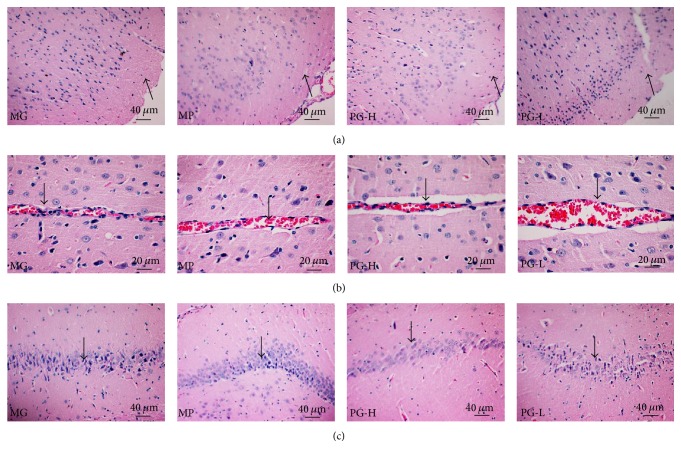
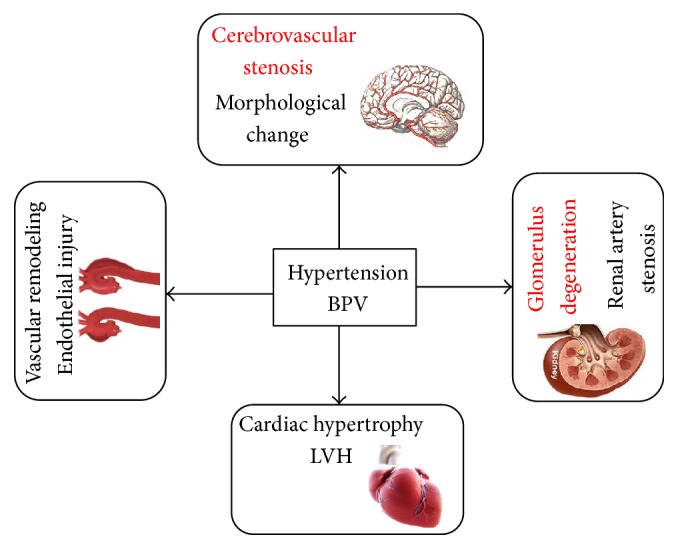
Blood pressure variability (BPV) is associated with the development and progression of severe target organ damage (TOD). This study aims to evaluate the protective effect of paeoniflorin enriched extract from Radix Paeoniae Alba (PG) on BPV and TOD in spontaneously hypertensive rats (SHR). All SHR were orally treated with distilled water, metoprolol (MP, 20 mg/kg), and PG (PG-H, 90 mg/kg or PG-L, 30 mg/kg) for a single time or daily for 7 weeks. The 24-hour dynamic blood pressure was monitored and then calculated BPV including long- and short-term systolic blood pressure variability (SBPV), diastolic blood pressure variability (DBPV), mean blood pressure variability (MBPV), and heart rate variability (HRV) as well as the 24-hour-SBP, 24-hour-DBP, and 24-hour-MBP. The protective effects of PG on TOD were observed by histopathologic and biochemical detection. The results indicated that long- and short-term SBPV, DBPV, MBPV, and HRV as well as 24-hour-SBP, 24-hour-DBP, and 24-hour-MBP showed no significant changes after single-dose administration of PG and significantly decreased after administration with PG for 7 weeks. PG could also markedly improve the damage of aorta, heart, kidney, and brain. This study suggested that PG could notably reduce BPV, stabilize blood pressure, and mitigate TOD in SHR.
Conflict of interest statement
The authors declare that they have no conflict of interests.
Figures
Similar articles
-
Combined Antihypertensive Effect of Paeoniflorin Enriched Extract and Metoprolol in Spontaneously Hypertensive Rats.Pharmacogn Mag. 2018 Jan-Mar;14(53):44-52. doi: 10.4103/pm.pm_483_16. Epub 2018 Feb 20. Pharmacogn Mag. 2018. PMID: 29576700 Free PMC article.
-
Hypertension-mediated organ damage regression associates with blood pressure variability improvement three years after successful treatment initiation in essential hypertension.J Clin Hypertens (Greenwich). 2021 Jun;23(6):1150-1158. doi: 10.1111/jch.14209. Epub 2021 Feb 7. J Clin Hypertens (Greenwich). 2021. PMID: 33554428 Free PMC article.
-
Relation between blood pressure variability and early renal damage in hypertensive patients.Eur Rev Med Pharmacol Sci. 2017 May;21(9):2226-2231. Eur Rev Med Pharmacol Sci. 2017. PMID: 28537660
-
Effect of exercise training on blood pressure variability in adults: A systematic review and meta-analysis.PLoS One. 2023 Oct 18;18(10):e0292020. doi: 10.1371/journal.pone.0292020. eCollection 2023. PLoS One. 2023. PMID: 37851627 Free PMC article.
-
Blood pressure variability and organ damage.Clin Exp Pharmacol Physiol. 2001 Sep;28(9):709-15. doi: 10.1046/j.1440-1681.2001.03508.x. Clin Exp Pharmacol Physiol. 2001. PMID: 11553028 Review.
Cited by
-
High-throughput metabolomics for evaluating the efficacy and discovering the metabolic mechanism of Luozhen capsules from the excessive liver-fire syndrome of hypertension.RSC Adv. 2019 Oct 9;9(55):32141-32153. doi: 10.1039/c9ra06622e. eCollection 2019 Oct 7. RSC Adv. 2019. PMID: 35530762 Free PMC article.
-
Shenzhi Jiannao formula ameliorates vascular dementia in vivo and in vitro by inhibition glutamate neurotoxicity via promoting clathrin-mediated endocytosis.Chin Med. 2021 Jul 28;16(1):65. doi: 10.1186/s13020-021-00477-4. Chin Med. 2021. PMID: 34321050 Free PMC article.
-
Hypertensive Rats Treated Chronically With Nω-Nitro-L-Arginine Methyl Ester (L-NAME) Induced Disorder of Hepatic Fatty Acid Metabolism and Intestinal Pathophysiology.Front Pharmacol. 2020 Jan 31;10:1677. doi: 10.3389/fphar.2019.01677. eCollection 2019. Front Pharmacol. 2020. PMID: 32076406 Free PMC article.
-
Paeoniflorin alleviates NG-nitro-L-arginine methyl ester (L-NAME)-induced gestational hypertension and upregulates silent information regulator 2 related enzyme 1 (SIRT1) to reduce H2O2-induced endothelial cell damage.Bioengineered. 2022 Feb;13(2):2248-2258. doi: 10.1080/21655979.2021.2024325. Bioengineered. 2022. PMID: 35030965 Free PMC article.
-
Safety and Efficacy Evaluation of Traditional Chinese Medicine (Qingre-Lishi-Yishen Formula) Based on Treatment of Regular Glucocorticoid Combined with Cyclophosphamide Pulse in Children Suffered from Moderately Severe Henoch-Schonlein Purpura Nephritis with Nephrotic Proteinuria.Evid Based Complement Alternat Med. 2020 Jan 27;2020:3920735. doi: 10.1155/2020/3920735. eCollection 2020. Evid Based Complement Alternat Med. 2020. PMID: 32047523 Free PMC article.
References
-
- Cai L., Zhang L., Liu A., Li S., Wang P. Prevalence, awareness, treatment, and control of hypertension among adults in Beijing, China. Clinical & Experimental Hypertension. 2012;19(2):159–168. - PubMed
-
- Zhang L., Cheng Y., Wang D. Circadian profiles of blood pressure and blood pressure variability in spontaneous hypertensive rats. Journal of Clinical Cardiology. 1996;12(4):239–241.
LinkOut - more resources
Full Text Sources
Other Literature Sources
Miscellaneous
