

Assessment of Skeletal Muscle Perfusion using Contrast-Enhanced Ultrasonography: Technical Note
- PMID: 28243350
- PMCID: PMC5317291
Assessment of Skeletal Muscle Perfusion using Contrast-Enhanced Ultrasonography: Technical Note
Abstract
Background: Intravenous contrast-enhanced ultrasonography is a recently developed technique for assessment of tissue perfusion, but has not been used for assessment of skeletal muscle perfusion.
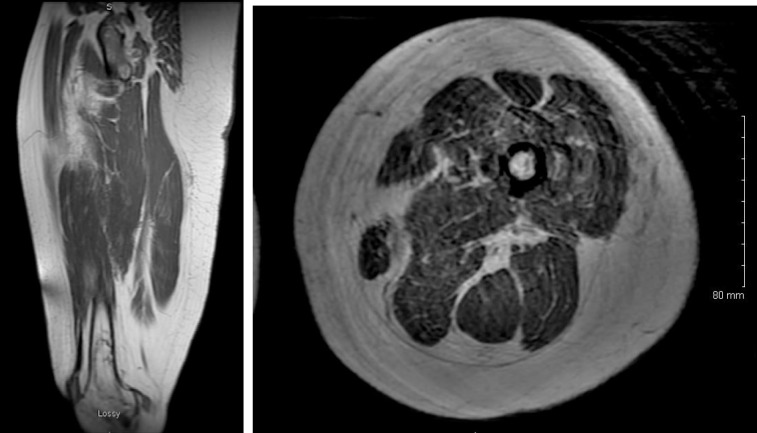
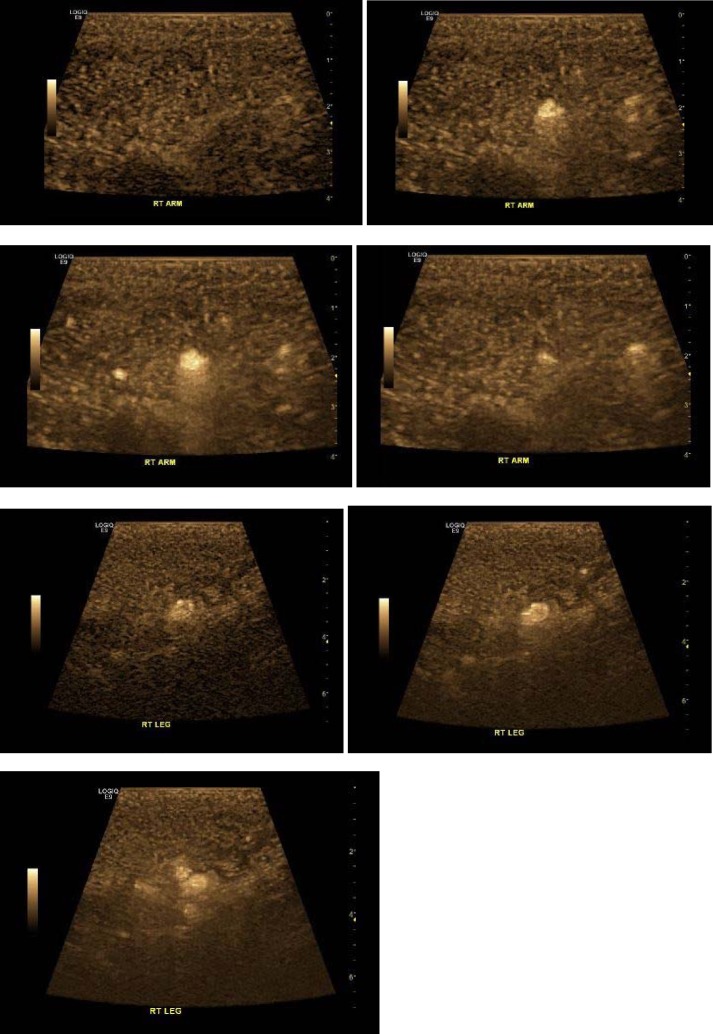
Methods: We studied a 42-year-old woman in whom myonecrosis was suspected due to systemic vasculitis and ischemia. The biceps brachii (right) and quadriceps femoris (vastus medialis) on right-hand side and subsequently left-hand side were imaged. Intravenous bolus of activated perflutren lipid microspheres was injected and B-Flow color mode (brown color) was used within a selected region of interest to image the passage of contrast through muscle parenchyma throughout three cardiac cycles.
Results: Visual interpretation of muscle perfusion was performed based on the maximal intensity of contrast in the muscle, and the speed of contrast replenishment. No deficits were noted in the perfusion pattern. The arterial phase demonstrated stellate vascularity, centrifugal filling, and homogeneous hypervascularity at peak enhancement.
Conclusions: The bolus of contrast resulted in good signal persistence and satisfactory imaging for multiple muscle groups.
Keywords: Muscle perfusion; contrast; lipid microspheres; muscle ischemia; myonecrosis; ultrasonography.
Figures
Similar articles
-
Imaging of the Vasa Nervorum Using Contrast-Enhanced Ultrasound.J Neuroimaging. 2017 Nov;27(6):583-588. doi: 10.1111/jon.12429. Epub 2017 Feb 14. J Neuroimaging. 2017. PMID: 28195441
-
Relationship of skeletal muscle perfusion measured by contrast-enhanced ultrasonography to histologic microvascular density.J Ultrasound Med. 2006 May;25(5):583-91. doi: 10.7863/jum.2006.25.5.583. J Ultrasound Med. 2006. PMID: 16632781
-
Assessment of skeletal muscle perfusion using contrast-enhanced ultrasonography.J Ultrasound Med. 2005 Apr;24(4):431-41. doi: 10.7863/jum.2005.24.4.431. J Ultrasound Med. 2005. PMID: 15784761
-
Contrast Enhanced Ultrasound Perfusion Imaging in Skeletal Muscle.J Cardiovasc Imaging. 2019 Jul;27(3):163-177. doi: 10.4250/jcvi.2019.27.e31. Epub 2019 May 20. J Cardiovasc Imaging. 2019. PMID: 31161755 Free PMC article. Review.
-
Italian Society of Cardiovascular Echography (SIEC) Consensus Conference on the state of the art of contrast echocardiography.Ital Heart J. 2004 Apr;5(4):309-34. Ital Heart J. 2004. PMID: 15185894 Review.
Cited by
-
Contrast-Enhanced Ultrasound of Muscle Perfusion May Indicate Patient Response to Left Ventricular Assist Device Therapy.J Ultrasound Med. 2021 Dec;40(12):2675-2683. doi: 10.1002/jum.15658. Epub 2021 Mar 5. J Ultrasound Med. 2021. PMID: 33665892 Free PMC article.
References
-
- de Jong N, et al. Basic acoustic properties of microbubbles. Echocardiography. 2002;19:229–240. - PubMed
-
- van den Oord SC, et al. Effect of carotid plaque screening using contrast-enhanced ultrasound on cardiovascular risk stratification. Am J Cardiol. 2013;111:754–759. - PubMed
-
- McArthur C, Baxter GM. Current and potential renal applications of contrast-enhanced ultrasound. Clin Radiol. 2012;67:909–922. - PubMed
LinkOut - more resources
Full Text Sources