Comparative Study
. 2017:2017:9210862.
doi: 10.1155/2017/9210862. Epub 2017 Jan 24.

Immune Profile of Obese People and In Vitro Effects of Red Grape Polyphenols on Peripheral Blood Mononuclear Cells

Affiliations
Comparative Study

Immune Profile of Obese People and In Vitro Effects of Red Grape Polyphenols on Peripheral Blood Mononuclear Cells

Thea Magrone et al. Oxid Med Cell Longev. 2017.

Erratum in

Abstract

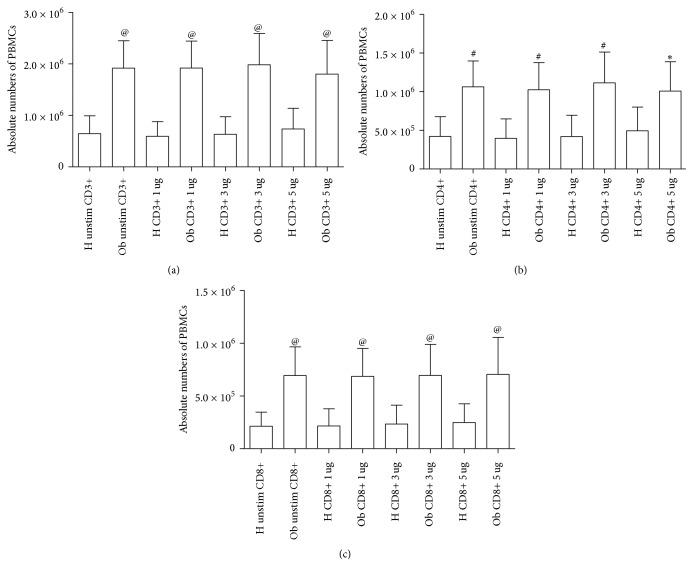
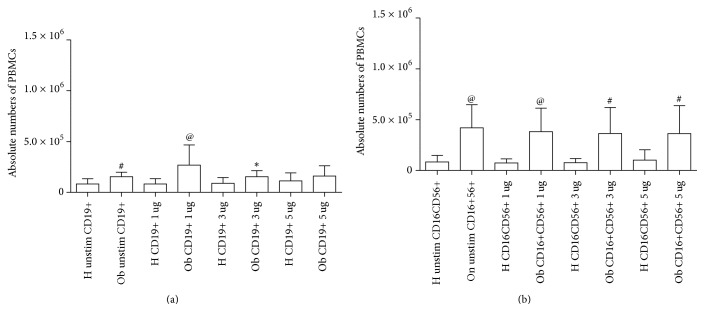
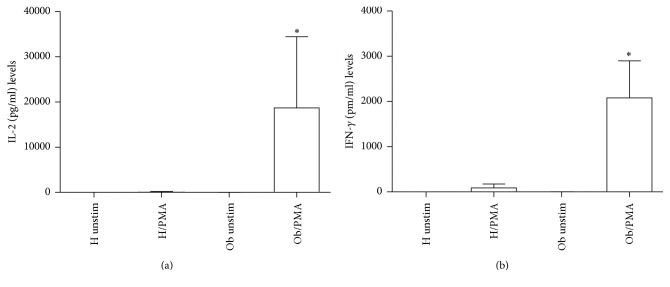
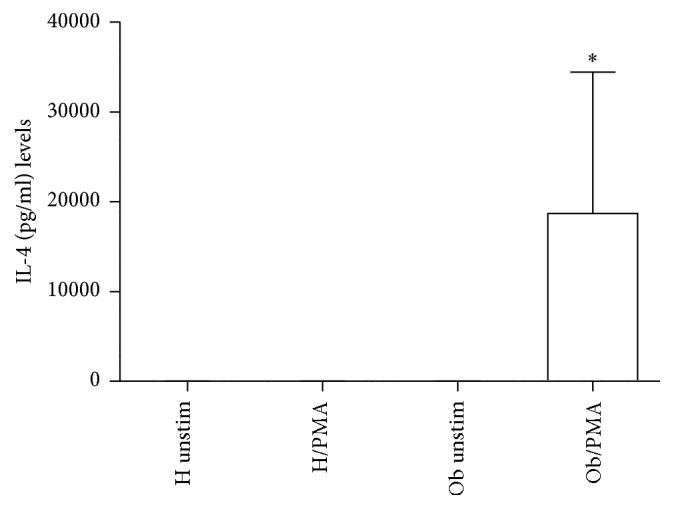
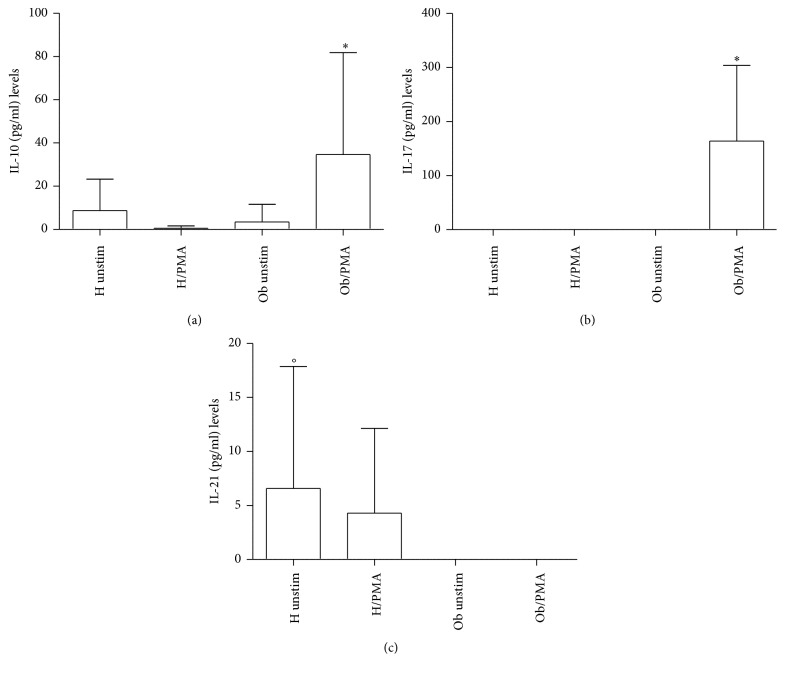
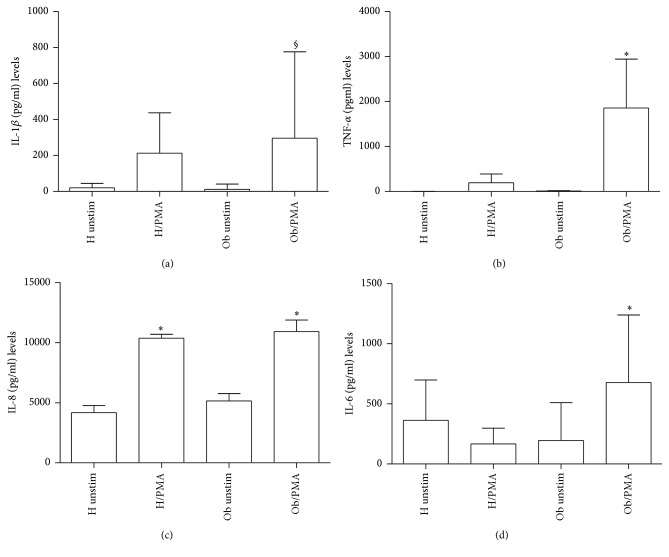
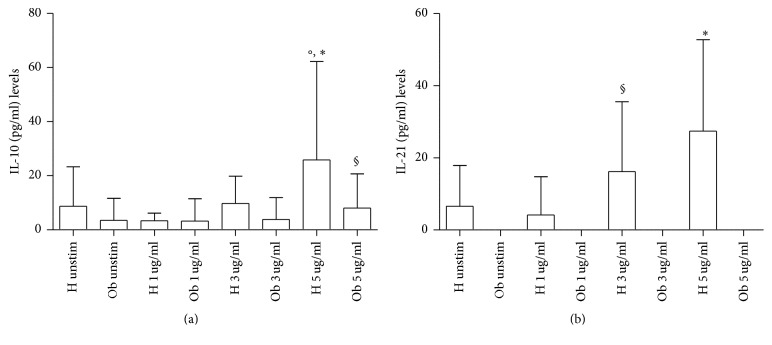
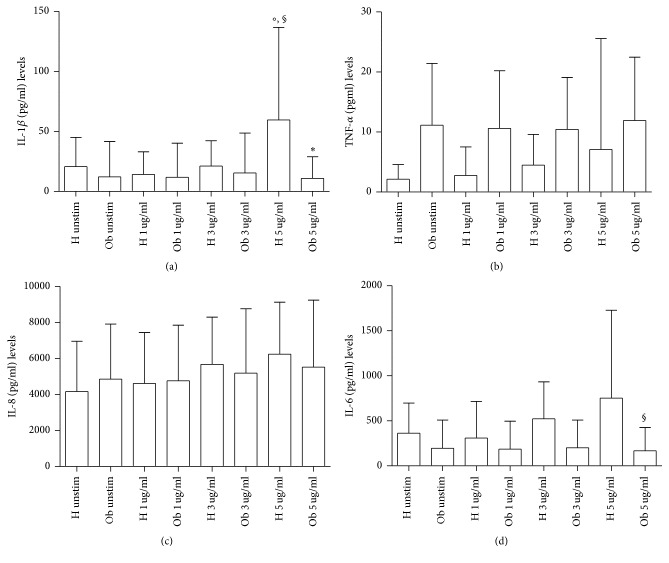
The in vitro ability of polyphenols, extracted from red grape, to modulate peripheral blood mononuclear cell responses has been evaluated in 20 obese (Ob) people. With regard to cytokine release in response to phorbol myristate acetate (PMA), levels of interleukin-2 (IL-2), interferon-γ (IFN-γ), IL-4, IL-10, and IL-17 were higher in the Ob than in healthy (H) subjects. Vice versa, IL-21 concentrations were detected only in H people but they were undetectable in the Ob counterpart. In general terms, levels of IL-1β, IL-6, IL-8, and tumor necrosis factor-α were higher in Ob people when compared to H controls. On the other hand, polyphenols did not modify IFN-γ, IL-4, and IL-17 levels. However, an increase in IL-2 was observed in H individuals, whereas its levels were decreased in the Ob counterpart. Polyphenols significantly increased IL-10 release from H donors, whereas a trend to increase was observed in Ob people. In addition, polyphenols were able to significantly increase levels of H IL-21, while this was not the case in Ob people. Since IL-21 is an inducer of Th17 cells, it is likely that polyphenols may suppress the sources of this cytokine via production of IL-10. Accordingly, polyphenols decreased IL-1β and IL-6 release in comparison to H controls.


Conflict of interest statement

The authors declare that they have no competing interests.

Figures

Figure 1
Figure 1
Absolute numbers of PBMCs from H and Ob individuals. (a) Absolute numbers of CD3+ cells from untreated and treated cells with 1, 3, and 5 μg polyphenols, respectively. (b) Absolute numbers of CD4+ cells from unstimulated and treated cells with 1, 3, and 5 μg dose polyphenols, respectively. (c) Absolute numbers of CD8+ cells from untreated and treated cells with 1, 3, and 5 μg dose polyphenols, respectively. H = healthy donors, Ob = obese people. Statistical analysis was performed using the GraphPad Prism statistical software release 5.0 for Windows Vista. Bonferroni's test was used for comparison between the H and Ob samples. Statistical significance was set at p < 0.05. (a) @p < 0.0001 H unstimulated versus Ob unstimulated, @p < 0.0001 H 1 μg/ml versus Ob 1 μg/ml, @p < 0.0001 H 3 μg/ml versus Ob 3 μg/ml; @p < 0.0001 H 5 μg/ml versus Ob 5 μg/ml: (b) #p < 0.001 H unstimulated versus Ob unstimulated, #p < 0.001 H 1 μg/ml versus Ob 1 μg/ml, #p < 0.001 H 3 μg/ml versus Ob 3 μg/ml, p < 0.05 H 5 μg/ml versus Ob 5 μg/ml; (c) @p < 0.0001 H unstimulated versus Ob unstimulated, @p < 0.0001 H 1 μg/ml versus Ob 1 μg/ml, @p < 0.0001 H 3 μg/ml versus Ob 3 μg/ml, @p < 0.0001 H 5 μg/ml versus Ob 5 μg/ml.
Figure 2
Figure 2
Absolute numbers of PBMCs in H and Ob individuals. (a) Absolute numbers of CD19+ cells from untreated and treated cells with 1, 3, and 5 μg dose polyphenols, respectively. (b) Absolute numbers of CD16+CD56+ cells from untreated and treated cells with 1, 3, and 5 μg dose polyphenols, respectively. For abbreviations and statistical analysis, see Figure 1. (a) #p < 0.001 H unstimulated versus Ob unstimulated, @p < 0.0001 H 1 μg/ml versus Ob 1 μg/ml, p < 0.05 H 3 μg/ml versus Ob 3 μg/ml (b) @p < 0.0001 H unstimulated versus Ob unstimulated, @p < 0.0001 H 1 μg/ml versus Ob 1 μg/ml, #p < 0.001 H 3 μg/ml versus Ob 3 μg/ml, #p < 0.001 H 5 μg/ml versus Ob 5 μg/ml.
Figure 3
Figure 3
Release of Th1-related cytokines in presence or absence of PMA. (a) IL-2 levels released from H and Ob PBMCs in presence or absence of PMA. (b) IFN-γ levels released from H and Ob PBMCs in presence or absence of PMA. For abbreviations and statistical analysis, see Figure 1. (a) p < 0.0001 H/PMA versus Ob/PMA; p < 0.0001 Ob unstimulated versus Ob/PMA; (b) p < 0.0001 H/PMA versus Ob/PMA; p < 0.0001 Ob unstimulated versus Ob/PMA.
Figure 4
Figure 4
Release of Th2-related cytokine in presence or absence of PMA. IL-4 levels released from H and Ob PBMCs in presence or absence of PMA. For abbreviations and statistical analysis, see Figure 1. p < 0.0001 H/PMA versus Ob/PMA: p < 0.0001 Ob unstimulated versus Ob/PMA.
Figure 5
Figure 5
Release of Treg/Th17-related cytokines. (a) IL-10 levels released from H and Ob PBMCs in presence or absence of PMA. (b) IL-17 levels released from H and Ob PBMCs in presence or absence of PMA. (c) IL-21 levels released from H and Ob PBMCs in presence or absence of PMA. For abbreviations and statistical analysis, see Figure 1. (a) p < 0.0001 H/PMA versus Ob/PMA; p < 0.0001 Ob unstimulated versus Ob/PMA; (b) p < 0.0001 H/PMA versus Ob/PMA, p < 0.0001 Ob unstimulated versus Ob/PMA; (c) °p < 0.05 H unstimulated versus Ob unstimulated.
Figure 6
Figure 6
Release of proinflammatory cytokines. (a) IL-1β levels released from H and Ob PBMCs in presence or absence of PMA. (b) TNF-α levels released from H and Ob PBMCs in presence or absence of PMA. (c) IL-8 levels released from H and Ob PBMCs in presence or absence of PMA. (d) IL-6 levels released from H and Ob PBMCs in presence or absence of PMA. For abbreviations and statistical analysis, see Figure 1. (a) §p < 0.001 Ob unstimulated versus Ob/PMA; (b) p < 0.0001 H/PMA versus Ob/PMA, p < 0.0001 Ob unstimulated versus Ob/PMA; (c) p < 0.0001 H unstimulated versus H/PMA, p < 0.0001 Ob unstimulated versus Ob/PMA; (d) p < 0.0001 H/PMA versus Ob/PMA, p < 0.0001 Ob unstimulated versus Ob/PMA.
Figure 7
Figure 7
Release of Th1-related cytokines in presence or absence of polyphenols. IL-2 levels released from H and Ob PBMCs in presence or absence of 1, 3, and 5 μg dose polyphenols, respectively. For abbreviations, see Figure 1.
Figure 8
Figure 8
Release of Treg related cytokines in presence or absence of polyphenols. (a) IL-10 levels released from H and Ob PBMCs in presence or absence of 1, 3, and 5 μg dose polyphenols, respectively. (b) IL-21 levels released from H and Ob PBMCs in presence or absence of 1, 3, and 5 μg dose polyphenols, respectively. For abbreviations and statistical analysis, see Figure 1. (a) °p < 0.05 H unstimulated versus H 5 μg/ml, p < 0.0001 H 1 μg/ml versus H 5 μg/ml, °p < 0.05 H 3 μg/ml versus H 5 μg/ml, §p < 0.001 H 5 μg/ml versus Ob 5 μg/ml; (b) p < 0.0001 H unstimulated versus H 5 μg/ml, p < 0.0001 H 1 μg/ml versus H 5 μg/ml, §p < 0.001 H 3 μg/ml versus Ob 3 μg/ml, p < 0.0001 H 5 μg/ml versus Ob 5 μg/ml.
Figure 9
Figure 9
Release of proinflammatory cytokines in presence or absence of polyphenols. (a) IL-1β levels released from H and Ob PBMCs in presence or absence of 1, 3, and 5 μg dose polyphenols, respectively. (b) TNF-α levels released from H and Ob PBMCs in presence or absence of 1, 3, and 5 μg dose polyphenols, respectively. (c) IL-8 levels released from H and Ob PBMCs in presence or absence of 1, 3, and 5 μg dose polyphenols, respectively. (d) IL-6 levels released from H and Ob PBMCs in presence or absence of 1, 3, and 5 μg dose polyphenols, respectively. For abbreviations and statistical analysis, see Figure 1. (a) °p < 0.05 H unstimulated versus H 5 μg/ml, §p < 0.001 H 1 μg/ml versus H 5 μg/ml, °p < 0.05 H 3 μg/ml versus H 5 μg/ml, p < 0.0001 H 5 μg/ml versus Ob 5 μg/ml; (d) §p < 0.001 H 5 μg/ml versus Ob 5 μg/ml.

References

    1. Mitchell S., Shaw D. The worldwide epidemic of female obesity. Best Practice and Research: Clinical Obstetrics and Gynaecology. 2015;29(3):289–299. doi: 10.1016/j.bpobgyn.2014.10.002. - DOI - PubMed
    1. Magrone T., Jirillo E. Childhood obesity: immune response and nutritional approaches. Frontiers in Immunology. 2015;6, article 76 doi: 10.3389/fimmu.2015.00076. - DOI - PMC - PubMed
    1. McGill A. T. Past and future corollaries of theories on causes of metabolic syndrome and obesity related co-morbidities part 2: a composite unifying theory review of human-specific co-adaptations to brain energy consumption. Archives of Public Health. 2014;72(1):p. 31. doi: 10.1186/2049-3258-72-31. - DOI - PMC - PubMed
    1. DeMarco V. G., Aroor A. R., Sowers J. R. The pathophysiology of hypertension in patients with obesity. Nature Reviews Endocrinology. 2014;10(6):364–376. doi: 10.1038/nrendo.2014.44. - DOI - PMC - PubMed
    1. De Pergola G., Silvestris F. Obesity as a major risk factor for cancer. Journal of Obesity. 2013;2013:11. doi: 10.1155/2013/291546.291546 - DOI - PMC - PubMed

Publication types

MeSH terms

LinkOut - more resources