

Phosphodiester content measured in human liver by in vivo 31 P MR spectroscopy at 7 tesla
- PMID: 28244131
- PMCID: PMC5697655
- DOI: 10.1002/mrm.26635
Phosphodiester content measured in human liver by in vivo 31 P MR spectroscopy at 7 tesla
Abstract
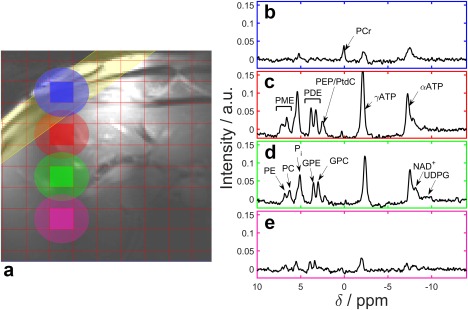
Purpose: Phosphorus (31 P) metabolites are emerging liver disease biomarkers. Of particular interest are phosphomonoester and phosphodiester (PDE) "peaks" that comprise multiple overlapping resonances in 31 P spectra. This study investigates the effect of improved spectral resolution at 7 Tesla (T) on quantifying hepatic metabolites in cirrhosis.
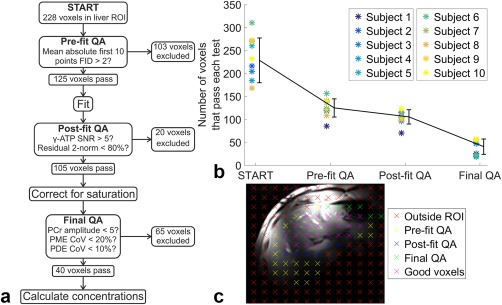
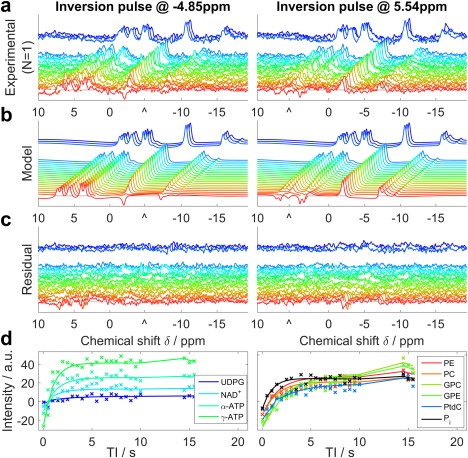
Methods: Five volunteers were scanned to determine metabolite T1 s. Ten volunteers and 11 patients with liver cirrhosis were scanned at 7T. Liver spectra were acquired in 28 min using a 16-channel 31 P array and 3D chemical shift imaging. Concentrations were calculated using γ-adenosine-triphosphate (γ-ATP) = 2.65 mmol/L wet tissue.
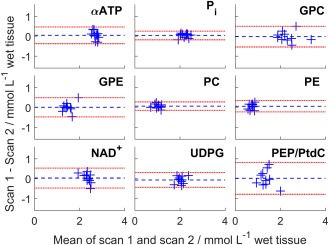
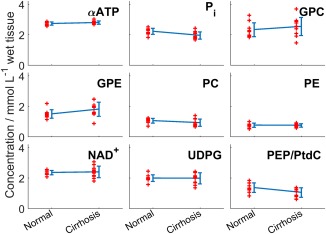
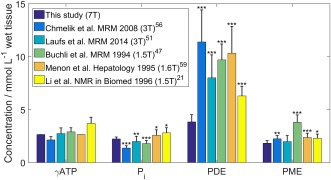
Results: T1 means ± standard deviations: phosphatidylcholine 1.05 ± 0.28 s, nicotinamide-adenine-dinucleotide (NAD+ ) 2.0 ± 1.0 s, uridine-diphosphoglucose (UDPG) 3.3 ± 1.4 s. Concentrations in healthy volunteers: α-ATP 2.74 ± 0.11 mmol/L wet tissue, inorganic phosphate 2.23 ± 0.20 mmol/L wet tissue, glycerophosphocholine 2.34 ± 0.46 mmol/L wet tissue, glycerophosphoethanolamine 1.50 ± 0.28 mmol/L wet tissue, phosphocholine 1.06 ± 0.16 mmol/L wet tissue, phosphoethanolamine 0.77 ± 0.14 mmol/L wet tissue, NAD+ 2.37 ± 0.14 mmol/L wet tissue, UDPG 2.00 ± 0.22 mmol/L wet tissue, phosphatidylcholine 1.38 ± 0.31 mmol/L wet tissue. Inorganic phosphate and phosphatidylcholine concentrations were significantly lower in patients; glycerophosphoethanolamine concentrations were significantly higher (P < 0.05).
Conclusion: We report human in vivo hepatic T1 s for phosphatidylcholine, NAD+ , and UDPG for the first time at 7T. Our protocol allows high signal-to-noise, repeatable measurement of metabolite concentrations in human liver. The splitting of PDE into its constituent peaks at 7T may allow more insight into changes in metabolism. Magn Reson Med 78:2095-2105, 2017. © 2017 The Authors Magnetic Resonance in Medicine published by Wiley Periodicals, Inc. on behalf of International Society for Magnetic Resonance in Medicine. This is an open access article under the terms of the Creative Commons Attribution License, which permits use, distribution and reproduction in any medium, provided the original work is properly cited.
Keywords: 31P; 7 Tesla; cirrhosis; human; in vivo; liver; magnetic resonance spectroscopy; phosphorus.
© 2017 The Authors Magnetic Resonance in Medicine published by Wiley Periodicals, Inc. on behalf of International Society for Magnetic Resonance in Medicine.
Figures
References
-
- Younossi ZM, Stepanova M, Afendy M, Fang Y, Younossi Y, Mir H, Srishord M. Changes in the prevalence of the most common causes of chronic liver diseases in the United States From 1988 to 2008. Clin Gastroenterol Hepatol 2011;9:524–530.e1. - PubMed
-
- Blachier M, Leleu H, Peck‐Radosavljevic M, Valla D‐C, Roudot‐Thoraval F. The burden of liver disease in Europe: a review of available epidemiological data. J Hepatol 2013;58:593–608. - PubMed
-
- Rockey DC, Caldwell SH, Goodman ZD, Nelson RC, Smith AD. Liver biopsy. Hepatology 2009;49:1017–1044. - PubMed
-
- Lee RG. General principles. Diagnostic liver pathology. St. Louis: Mosby‐Year Book; 1994. p 1–21.
-
- Maharaj B, Leary WP, Naran AD, Maharaj RJ, Cooppan RM, Pirie D, Pudifin DJ. Sampling variability and its influence on the diagnostic yield of percutaneous needle biopsy of the liver. Lancet 1986;327:523–525. - PubMed
MeSH terms
Substances
Grants and funding
LinkOut - more resources
Full Text Sources
Other Literature Sources
Medical
