

National Performance Benchmarks for Modern Diagnostic Digital Mammography: Update from the Breast Cancer Surveillance Consortium
- PMID: 28244803
- PMCID: PMC5375630
- DOI: 10.1148/radiol.2017161519
National Performance Benchmarks for Modern Diagnostic Digital Mammography: Update from the Breast Cancer Surveillance Consortium
Abstract
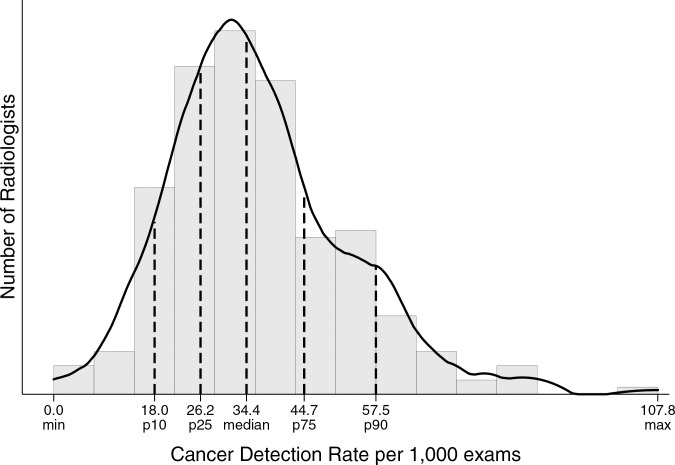
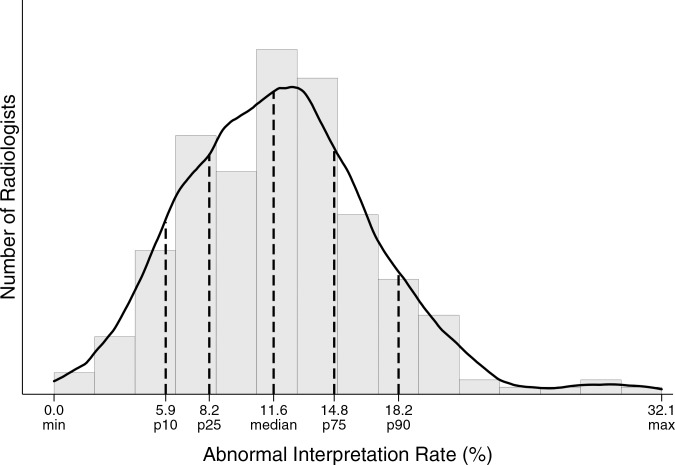
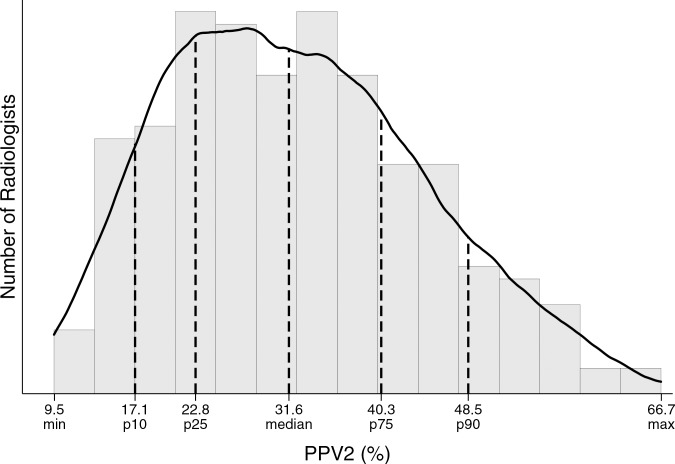
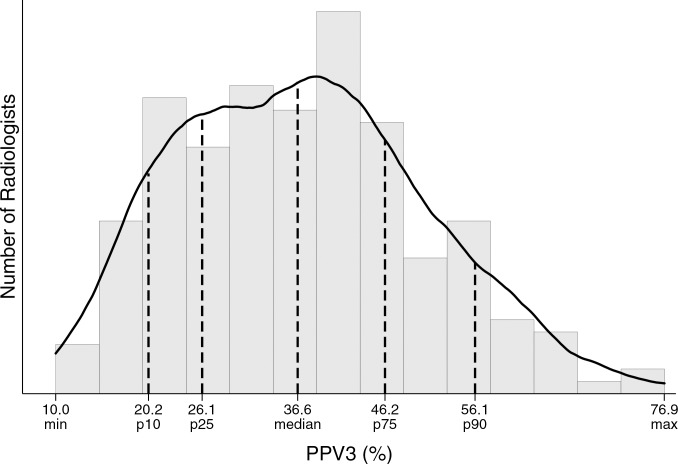
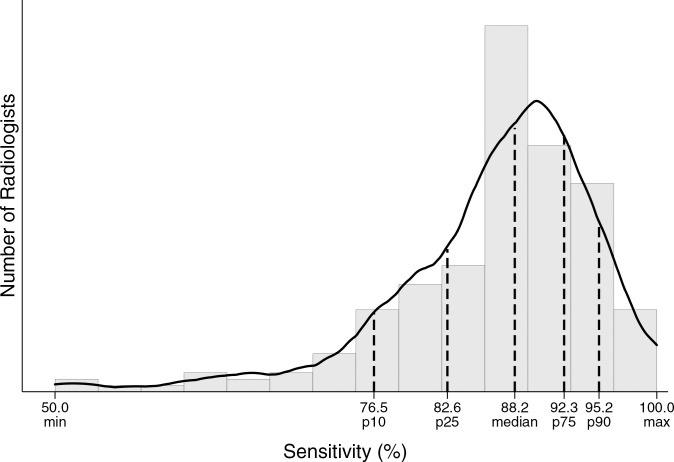
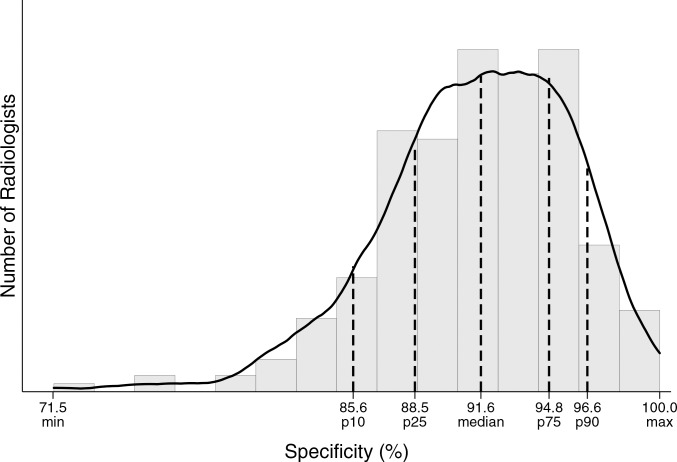
Purpose To establish contemporary performance benchmarks for diagnostic digital mammography with use of recent data from the Breast Cancer Surveillance Consortium (BCSC). Materials and Methods Institutional review board approval was obtained for active or passive consenting processes or to obtain a waiver of consent to enroll participants, link data, and perform analyses. Data were obtained from six BCSC registries (418 radiologists, 92 radiology facilities). Mammogram indication and assessments were prospectively collected for women undergoing diagnostic digital mammography and linked with cancer diagnoses from state cancer registries. The study included 401 548 examinations conducted from 2007 to 2013 in 265 360 women. Results Overall diagnostic performance measures were as follows: cancer detection rate, 34.7 per 1000 (95% confidence interval [CI]: 34.1, 35.2); abnormal interpretation rate, 12.6% (95% CI: 12.5%, 12.7%); positive predictive value (PPV) of a biopsy recommendation (PPV2), 27.5% (95% CI: 27.1%, 27.9%); PPV of biopsies performed (PPV3), 30.4% (95% CI: 29.9%, 30.9%); false-negative rate, 4.8 per 1000 (95% CI: 4.6, 5.0); sensitivity, 87.8% (95% CI: 87.3%, 88.4%); and specificity, 90.5% (95% CI: 90.4%, 90.6%). Among cancers detected, 63.4% were stage 0 or 1 cancers, 45.6% were minimal cancers, the mean size of invasive cancers was 21.2 mm, and 69.6% of invasive cancers were node negative. Performance metrics varied widely across diagnostic indications, with cancer detection rate (64.5 per 1000) and abnormal interpretation rate (18.7%) highest for diagnostic mammograms obtained to evaluate a breast problem with a lump. Compared with performance during the screen-film mammography era, diagnostic digital performance showed increased abnormal interpretation and cancer detection rates and decreasing PPVs, with less than 70% of radiologists within acceptable ranges for PPV2 and PPV3. Conclusion These performance measures can serve as national benchmarks that may help transform the marked variation in radiologists' diagnostic performance into targeted quality improvement efforts. © RSNA, 2017 Online supplemental material is available for this article.
Figures
Comment in
-
2017 Breast Cancer Surveillance Consortium Reports on Interpretive Performance at Screening and Diagnostic Mammography: Welcome New Data, But Not as Benchmarks for Practice.Radiology. 2017 Apr;283(1):7-9. doi: 10.1148/radiol.2017170181. Epub 2017 Feb 28. Radiology. 2017. PMID: 28244802 No abstract available.
References
-
- American College of Radiology . ACR BI-RADS—mammography. In: ACR BI-RADS atlas: breast imaging reporting and data system. 5th ed. Reston, Va: American College of Radiology, 2013.
-
- Monsees BS. The Mammography Quality Standards Act: an overview of the regulations and guidance. Radiol Clin North Am 2000;38(4):759–772. - PubMed
-
- Sickles EA, Miglioretti DL, Ballard-Barbash R, et al. Performance benchmarks for diagnostic mammography. Radiology 2005;235(3):775–790. - PubMed
-
- The Breast Cancer Surveillance Consortium . Performance benchmarks for diagnostic mammography. http://breastscreening.cancer.gov/statistics/benchmarks/diagnostic/. Updated 2007. Accessed September 8, 2016.
Publication types
MeSH terms
Grants and funding
LinkOut - more resources
Full Text Sources
Other Literature Sources
Medical
