CYP2D6 pharmacogenetic and oxycodone pharmacokinetic association study in pediatric surgical patients
- PMID: 28244808
- PMCID: PMC5558529
- DOI: 10.2217/pgs-2016-0183
CYP2D6 pharmacogenetic and oxycodone pharmacokinetic association study in pediatric surgical patients
Abstract
Aim: Oxycodone is partly metabolized to the active metabolite oxymorphone by hepatic CYP2D6 in the liver. Significant genetic variability in CYP2D6 activity affects oxymorphone formation. This study aimed to associate CYP2D6 genotype and oxycodone's metabolism.
Methods: 30 children were administered oral oxycodone postoperatively. Plasma levels of oxycodone and oxymorphone, and CYP2D6 genotype were analyzed. CYP2D6 genotype and oxycodone metabolism phenotype were determined based on CYP2D6 total activity score (TAS) and metabolism phenotype: poor metabolizer (PM), intermediate metabolizer (IM), extensive metabolizer (EM) or ultrarapid metabolizer (UM).
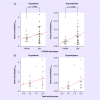
Results: Compared with PM/IM subjects, significantly greater oxymorphone exposure was seen in EM subjects (p = 0.02 for Cmax, p = 0.016 for AUC0-6 and p = 0.026 for AUC0-24). Similarly, higher TAS value was found to be associated with greater oxymorphone exposure. Higher conversion of oxycodone to oxymorphone was observed in EM subjects compared with PM/IM subjects (p = 0.0007 for Cmax, p = 0.001 for AUC0-6 and p = 0.004 for AUC0-24).
Conclusion: CYP2D6 phenotypes explain metabolism of oxycodone in children, and oxymorphone exposure is higher in CYP2D6 EM phenotype. Further studies are needed to predict the occurrence of adverse event and tailor oxycodone dose for a specific CYP2D6 phenotype.
Keywords: CYP2D6; oxycodone; pediatrics; pharmacogenetics; pharmacokinetics; surgical pain.
Conflict of interest statement
The project's pharmacokinetic assay was supported by Vistapharm as part of an ongoing Phase IV study to characterize the pharmacokinetics and to evaluate the safety of oxycodone in children (Principal Investigator: S Sadhasivam). In addition, the CYP2D6 genetic analysis and data analysis were partly supported by funds from Cincinnati Children's Hospital Medical Center and the R01 HD089458 through the Eunice Kennedy Shriver National Institute of Child Health and Human Development, NIH (Principal Investigator: S Sadhasivam). The content is solely the responsibility of the authors and does not necessarily represent the official views of the NIH. The authors have no other relevant affiliations or financial involvement with any organization or entity with a financial interest in or financial conflict with the subject matter or materials discussed in the manuscript apart from those disclosed.
No writing assistance was utilized in the production of this manuscript.
Figures


Similar articles
-
Personalized oxycodone dosing: using pharmacogenetic testing and clinical pharmacokinetics to reduce toxicity risk and increase effectiveness.Pain Med. 2014 May;15(5):791-806. doi: 10.1111/pme.12380. Epub 2014 Feb 12. Pain Med. 2014. PMID: 24517173 Clinical Trial.
-
CYP2D6 genotype dependent oxycodone metabolism in postoperative patients.PLoS One. 2013;8(3):e60239. doi: 10.1371/journal.pone.0060239. Epub 2013 Mar 28. PLoS One. 2013. PMID: 23555934 Free PMC article.
-
The effects of CYP2D6 and CYP3A activities on the pharmacokinetics of immediate release oxycodone.Br J Pharmacol. 2010 Jun;160(4):907-18. doi: 10.1111/j.1476-5381.2010.00673.x. Br J Pharmacol. 2010. PMID: 20590587 Free PMC article. Clinical Trial.
-
Cytochrome P450-mediated changes in oxycodone pharmacokinetics/pharmacodynamics and their clinical implications.Drugs. 2013 May;73(6):533-43. doi: 10.1007/s40265-013-0036-0. Drugs. 2013. PMID: 23605691 Review.
-
The pharmacokinetics of oxycodone.J Pain Palliat Care Pharmacother. 2004;18(4):17-30. doi: 10.1300/j354v18n04_03. J Pain Palliat Care Pharmacother. 2004. PMID: 15760805 Review.
Cited by
-
Opioids: A Review of Pharmacokinetics and Pharmacodynamics in Neonates, Infants, and Children.Eur J Drug Metab Pharmacokinet. 2019 Oct;44(5):591-609. doi: 10.1007/s13318-019-00552-0. Eur J Drug Metab Pharmacokinet. 2019. PMID: 31006834 Review.
-
Pharmacogenetic Gene-Drug Associations in Pediatric Burn and Surgery Patients.J Burn Care Res. 2022 Sep 1;43(5):987-996. doi: 10.1093/jbcr/irac062. J Burn Care Res. 2022. PMID: 35639664 Free PMC article.
-
Pharmacogenetic Guided Opioid Therapy Improves Chronic Pain Outcomes and Comorbid Mental Health: A Randomized, Double-Blind, Controlled Study.Int J Mol Sci. 2023 Jun 28;24(13):10754. doi: 10.3390/ijms241310754. Int J Mol Sci. 2023. PMID: 37445931 Free PMC article. Clinical Trial.
-
Les opioïdes par voie orale en remplacement de la codéine pour contrôler la douleur chez les enfants.Paediatr Child Health. 2021 Mar 16;26(2):120-127. doi: 10.1093/pch/pxaa134. eCollection 2021 Apr-May. Paediatr Child Health. 2021. PMID: 33747308 Free PMC article. Review.
-
Effects of pharmacogenetic profiles on pediatric pain relief and adverse events with ibuprofen and oxycodone.Pain Rep. 2023 Oct 17;8(6):e1113. doi: 10.1097/PR9.0000000000001113. eCollection 2023 Dec. Pain Rep. 2023. PMID: 38027465 Free PMC article.
References
-
- Stewart DW, Ragg PG, Sheppard S, Chalkiadis GA. The severity and duration of postoperative pain and analgesia requirements in children after tonsillectomy, orchidopexy, or inguinal hernia repair. Paediatr. Anaesth. 2012;22(2):136–143. - PubMed
-
- Bell GC, Donovan KA, Mcleod HL. Clinical implications of opioid pharmacogenomics in patients with cancer. Cancer Control. 2015;22(4):426–432. - PubMed
-
- Niesters M, Overdyk F, Smith T, Aarts L, Dahan A. Opioid-induced respiratory depression in paediatrics: a review of case reports. Br. J. Anaesth. 2013;110(2):175–182. - PubMed
-
- Ewah BN, Robb PJ, Raw M. Postoperative pain, nausea and vomiting following paediatric day-case tonsillectomy. Anaesthesia. 2006;61(2):116–122. - PubMed
Publication types
MeSH terms
Substances
Grants and funding
LinkOut - more resources
Full Text Sources
Other Literature Sources
