

BMI z-Scores are a poor indicator of adiposity among 2- to 19-year-olds with very high BMIs, NHANES 1999-2000 to 2013-2014
- PMID: 28245098
- PMCID: PMC5373980
- DOI: 10.1002/oby.21782
BMI z-Scores are a poor indicator of adiposity among 2- to 19-year-olds with very high BMIs, NHANES 1999-2000 to 2013-2014
Abstract
Objective: Although the Centers for Disease Control and Prevention (CDC) growth charts are widely used, BMI-for-age z-Scores (BMIz) are known to be uninformative above the 97th percentile. This study compared the relations of BMIz and other BMI metrics (%BMIp95 , percent of 95th percentile, and ΔBMIp95 , BMI minus 95th percentile) to circumferences, skinfolds, and fat mass. We were particularly interested in the differences among children with severe obesity (%BMIp95 ≥ 120).
Methods: Data was used from 30,003 2- to 19-year-olds who were examined from 1999-2000 through 2013-2014 in the National Health and Nutrition Examination Survey (NHANES).
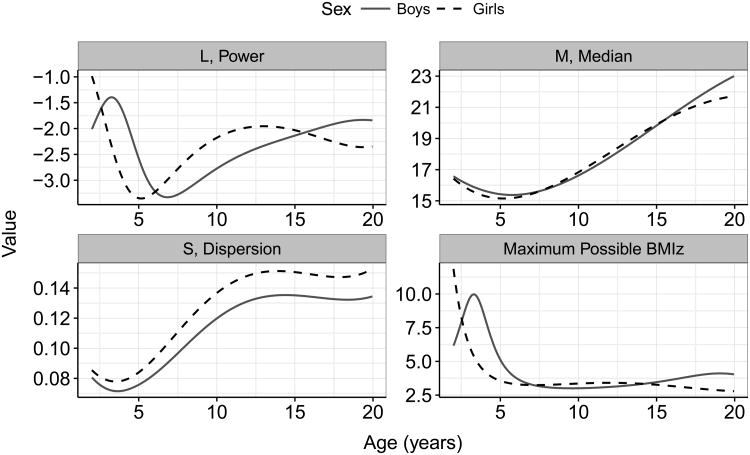
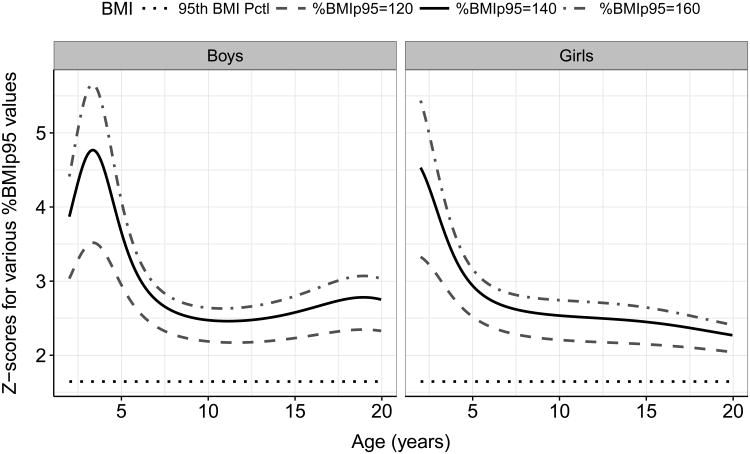
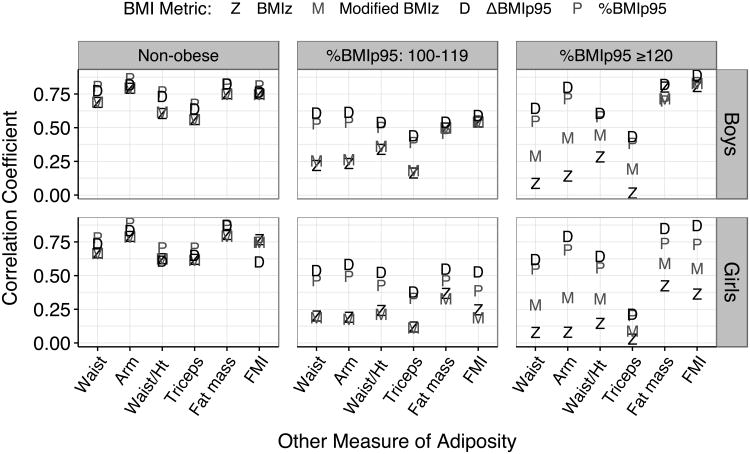
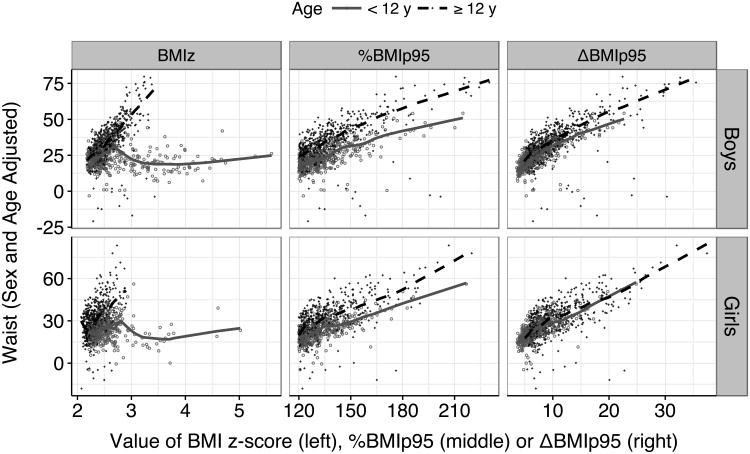
Results: The theoretical maximum BMIz based on the growth charts varied by more than threefold across ages. The BMI metrics were strongly intercorrelated, but BMIz was less strongly related to the adiposity measures than were ΔBMIp95 and %BMIp95 . Among children with severe obesity, circumferences and triceps skinfold showed almost no association with BMIz (r ≤ 0.10), whereas associations with %BMIp95 and ΔBMIp95 ranged from r = 0.32 to 0.79. Corresponding associations with fat mass ÷ height2 ranged from r = 0.40 (BMIz) to r =0.82 (%BMIp95 ) among 8- to 19-year-olds.
Conclusions: Among children with severe obesity, BMIz is only weakly associated with other measures of body fatness. Very high BMIs should be expressed relative to the CDC 95th percentile, particularly in studies that evaluate obesity interventions.
© 2017 The Obesity Society.
Conflict of interest statement
Disclosure: The authors declare no conflict of interest
Figures
Comment in
-
Assessing adiposity using BMI z-Score in children with severe obesity.Obesity (Silver Spring). 2017 Apr;25(4):662. doi: 10.1002/oby.21800. Epub 2017 Mar 11. Obesity (Silver Spring). 2017. PMID: 28296206 No abstract available.
References
-
- Kuczmarski RJ, Ogden CL, Guo SS, et al. 2000 CDC Growth Charts for the United States: methods and development. Vital Health Stat 11. 2002;11:1–190. - PubMed
-
- Ogden CL, Flegal KM. Changes in terminology for childhood overweight and obesity. Natl Health Stat Report. 2010:1–5. - PubMed
-
- Flegal KM, Cole TJ. Construction of LMS parameters for the Centers for Disease Control and Prevention 2000 growth charts. Natl Health Stat Report. 2013;9:1–3. - PubMed
-
- Cole TJ, Green PJ. Smoothing reference centile curves: the LMS method and penalized likelihood. Stat Med. 1992;11:1305–19. - PubMed
-
- Flegal KM, Wei R, Ogden CL, Freedman DS, Johnson CL, Curtin LR. Characterizing extreme values of body mass index-for-age by using the 2000 Centers for Disease Control and Prevention growth charts. Am J Clin Nutr. 2009;90:1314–1320. - PubMed
MeSH terms
Grants and funding
LinkOut - more resources
Full Text Sources
Other Literature Sources
Medical
Research Materials
Miscellaneous
