

Temporal Trends in Treatment and Subsequent Neoplasm Risk Among 5-Year Survivors of Childhood Cancer, 1970-2015
- PMID: 28245323
- PMCID: PMC5473951
- DOI: 10.1001/jama.2017.0693
Temporal Trends in Treatment and Subsequent Neoplasm Risk Among 5-Year Survivors of Childhood Cancer, 1970-2015
Abstract
Importance: Cancer treatments are associated with subsequent neoplasms in survivors of childhood cancer. It is unknown whether temporal changes in therapy are associated with changes in subsequent neoplasm risk.
Objective: To quantify the association between temporal changes in treatment dosing and subsequent neoplasm risk.
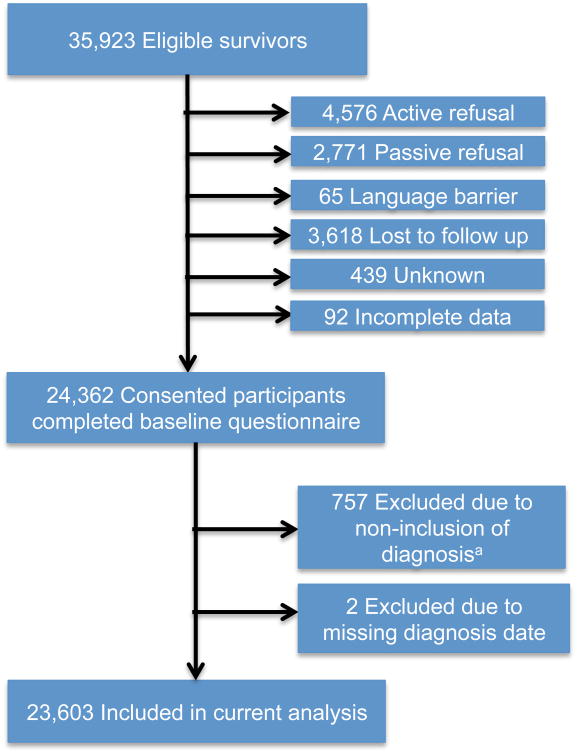
Design, setting, and participants: Retrospective, multicenter cohort study of 5-year cancer survivors diagnosed before age 21 years from pediatric tertiary hospitals in the United States and Canada between 1970-1999, with follow-up through December 2015.
Exposures: Radiation and chemotherapy dose changes over time.
Main outcomes and measures: Subsequent neoplasm 15-year cumulative incidence, cumulative burden, and standardized incidence ratios for subsequent malignancies, compared by treatment decade. Multivariable models assessed relative rates (RRs) of subsequent neoplasms by 5-year increments, adjusting for demographic and clinical characteristics. Mediation analyses assessed whether changes in rates of subsequent neoplasms over time were mediated by treatment variable modifications.
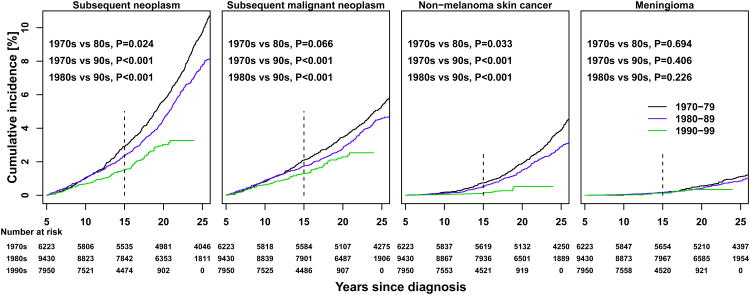
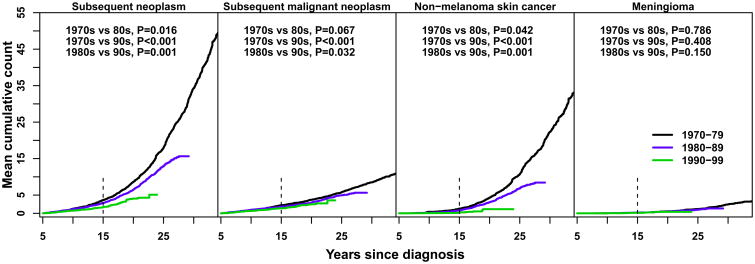
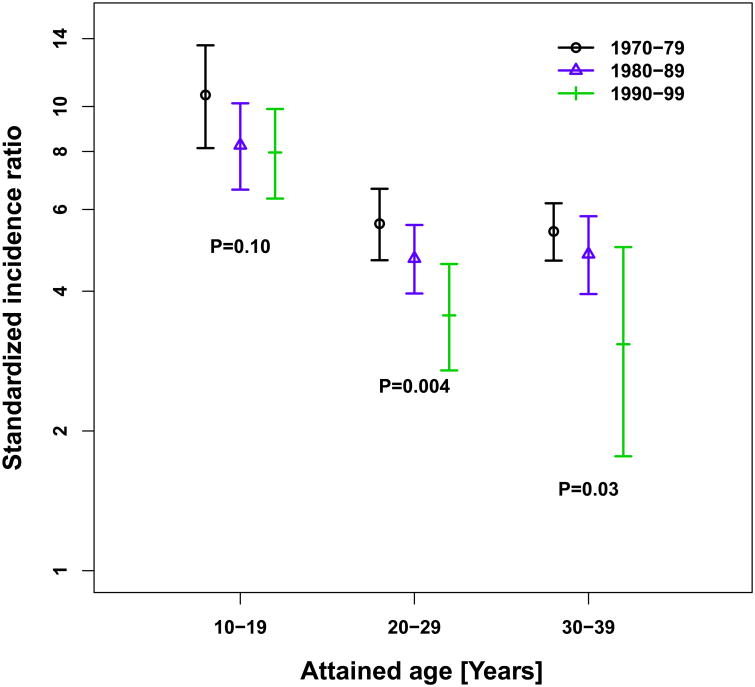
Results: Among 23 603 survivors of childhood cancer (mean age at diagnosis, 7.7 years; 46% female) the most common initial diagnoses were acute lymphoblastic leukemia, Hodgkin lymphoma, and astrocytoma. During a mean follow-up of 20.5 years (374 638 person-years at risk), 1639 survivors experienced 3115 subsequent neoplasms, including 1026 malignancies, 233 benign meningiomas, and 1856 nonmelanoma skin cancers. The most common subsequent malignancies were breast and thyroid cancers. Proportions of individuals receiving radiation decreased (77% for 1970s vs 33% for 1990s), as did median dose (30 Gy [interquartile range, 24-44] for 1970s vs 26 Gy [interquartile range, 18-45] for 1990s). Fifteen-year cumulative incidence of subsequent malignancies decreased by decade of diagnosis (2.1% [95% CI, 1.7%-2.4%] for 1970s, 1.7% [95% CI, 1.5%-2.0%] for 1980s, 1.3% [95% CI, 1.1%-1.5%] for 1990s). Reference absolute rates per 1000 person-years were 1.12 (95% CI, 0.84-1.57) for subsequent malignancies, 0.16 (95% CI, 0.06-0.41) for meningiomas, and 1.71 (95% CI, 0.88-3.33) for nonmelanoma skin cancers for survivors with reference characteristics (no chemotherapy, splenectomy, or radiation therapy; male; attained age 28 years). Standardized incidence ratios declined for subsequent malignancies over treatment decades, with advancing attained age. Relative rates declined with each 5-year increment for subsequent malignancies (RR, 0.87 [95% CI, 0.82-0.93]; P < .001), meningiomas (RR, 0.85 [95% CI, 0.75-0.97]; P = .03), and nonmelanoma skin cancers (RR, 0.75 [95% CI, 0.67-0.84]; P < .001). Radiation dose changes were associated with reduced risk for subsequent malignancies, meningiomas, and nonmelanoma skin cancers.
Conclusions and relevance: Among survivors of childhood cancer, the risk of subsequent malignancies at 15 years after initial cancer diagnosis remained increased for those diagnosed in the 1990s, although the risk was lower compared with those diagnosed in the 1970s. This lower risk was associated with reduction in therapeutic radiation dose.
Conflict of interest statement
The authors have no conflicts of interest to report.
Figures
Comment in
-
Temporal Changes in Subsequent Malignancies Among Childhood Cancer Survivors.JAMA. 2017 Jun 20;317(23):2451. doi: 10.1001/jama.2017.6020. JAMA. 2017. PMID: 28632860 No abstract available.
References
-
- Hudson MM, Mertens AC, Yasui Y, et al. Health status of adult long-term survivors of childhood cancer: a report from the Childhood Cancer Survivor Study. JAMA : the journal of the American Medical Association. 2003;290(12):1583–1592. - PubMed
Publication types
MeSH terms
Substances
Grants and funding
LinkOut - more resources
Full Text Sources
Other Literature Sources
