. 2017 Feb 28;18(1):216.
doi: 10.1186/s12864-017-3586-9.

Differentiation of ncRNAs from small mRNAs in Escherichia coli O157:H7 EDL933 (EHEC) by combined RNAseq and RIBOseq - ryhB encodes the regulatory RNA RyhB and a peptide, RyhP

Affiliations

Differentiation of ncRNAs from small mRNAs in Escherichia coli O157:H7 EDL933 (EHEC) by combined RNAseq and RIBOseq - ryhB encodes the regulatory RNA RyhB and a peptide, RyhP

Klaus Neuhaus et al. BMC Genomics. .

Abstract

Background: While NGS allows rapid global detection of transcripts, it remains difficult to distinguish ncRNAs from short mRNAs. To detect potentially translated RNAs, we developed an improved protocol for bacterial ribosomal footprinting (RIBOseq). This allowed distinguishing ncRNA from mRNA in EHEC. A high ratio of ribosomal footprints per transcript (ribosomal coverage value, RCV) is expected to indicate a translated RNA, while a low RCV should point to a non-translated RNA.

Results: Based on their low RCV, 150 novel non-translated EHEC transcripts were identified as putative ncRNAs, representing both antisense and intergenic transcripts, 74 of which had expressed homologs in E. coli MG1655. Bioinformatics analysis predicted statistically significant target regulons for 15 of the intergenic transcripts; experimental analysis revealed 4-fold or higher differential expression of 46 novel ncRNA in different growth media. Out of 329 annotated EHEC ncRNAs, 52 showed an RCV similar to protein-coding genes, of those, 16 had RIBOseq patterns matching annotated genes in other enterobacteriaceae, and 11 seem to possess a Shine-Dalgarno sequence, suggesting that such ncRNAs may encode small proteins instead of being solely non-coding. To support that the RIBOseq signals are reflecting translation, we tested the ribosomal-footprint covered ORF of ryhB and found a phenotype for the encoded peptide in iron-limiting condition.

Conclusion: Determination of the RCV is a useful approach for a rapid first-step differentiation between bacterial ncRNAs and small mRNAs. Further, many known ncRNAs may encode proteins as well.


Figures
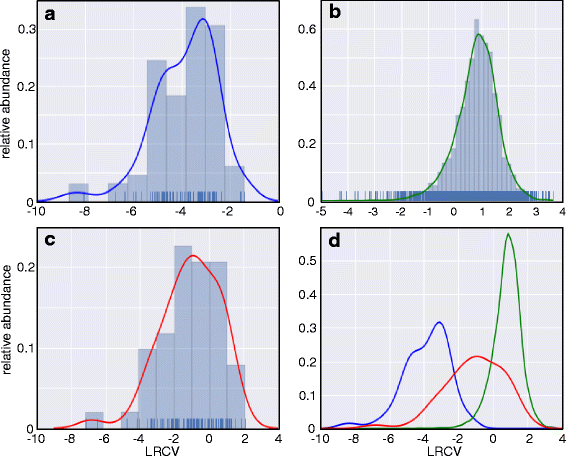
Fig. 1
Fig. 1
Logarithmic (ln) ribosomal coverage (LRCV) of tRNAs, annotated genes, annotated ncRNAs and a merger of the former. a Histogram of the LRCVs (X-axis) of the tRNAs together with either the estimated density function (blue curve). The density of the individual tRNAs is shown as little blue bars on top of the X-axis. b LRCV histogram as before, but of the annotated genes and their estimated density function (green). c LRCV histogram as before, but of the known ncRNAs (see Table 1) together with their estimated density function (red). d A combination of the estimated density functions for the tRNAs (blue), the annotated genes (green) and the ncRNAs (red) of the former panels, shown a substantial overlap between the annotated genes and the ncRNAs supposedly non-coding
Fig. 2
Fig. 2
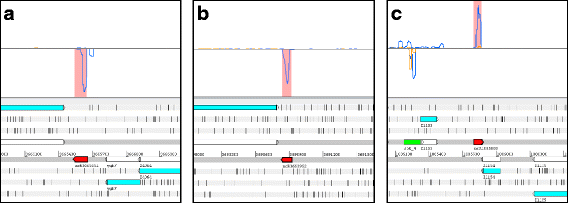
Three examples of novel ncRNAs detected using transcriptome and translatome analysis. A genomic area is visualized in Artemis 15.0.0 [43]. In the lower part of the panels, the genome (shown as grey lines) is visualized in a six-frame translation mode. Numbers given between the grey lines indicate the genome coordinates. On top of the forward strand are three reading frames and on the reverse DNA strand are three further reading frames. Each reading frame represented is visible by the indicated stop codons (vertical black bars). Annotated genes are shown in their respective reading frame (turquoise arrows) and also on the DNA strand itself (white arrows). The gene name is written below each arrow. Any protein-coding ORF must be at least located between two black bars, with the downstream stop codon being the translational stop. In the upper part of the panels, the DNA is indicated by a thin black line and the sequencing reads matching to the forward or reverse strand are shown above or below this line. The sequencing reads from the footprint (yellow line) and transcriptome (blue line) sequencing are shown as coverage plot, respectively. The pink shaded area in the coverage plot corresponds to the novel ncRNAs, which are drawn in by red arrows. Novel ncRNAs were identified by their very low RCV, thus, hardly any footprint reads (in yellow) but a number of transcriptome reads (in blue; see Table 2). Known ncRNAs are indicated on the DNA by a bright green arrow. Since ncRNAs supposedly do not contain a protein-coding ORF, these genes are only shown on the DNA. a ncR3665651. b ncR3690952. c ncR1085800
Fig. 3
Fig. 3
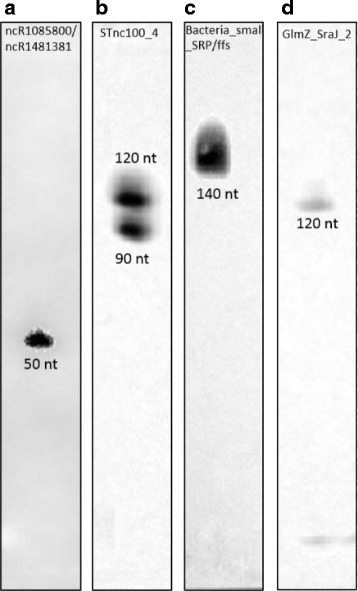
Detection of novel and annotated ncRNAs by Northern blots. Since ncRNAs do not have defined ends like, e.g., ORFs which have start and stop codons, their actual length may differ somewhat from the expected length (compare to Table 1). The contrast of the bands has been adjusted by gamma correction using digital image processing for better visibility. a ncR1085800 and ncR1481381. Both ncRNAs are indistinguishable by their sequence. b STnc100_4. c Bacteria_small SRP/ffs. d GlmZ_SraJ_2
Fig. 4
Fig. 4
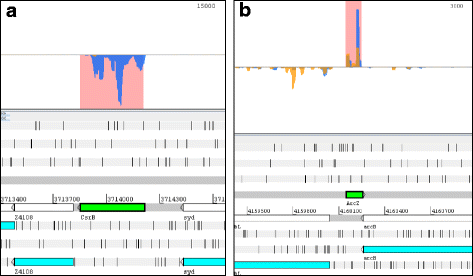
Visualization of ribosomal footprints and transcript reads mapping to annotated ncRNAs as coverage plots. A genomic area is visualized in Artemis 15.0.0 [43]. In the lower part of the panels, the genome (shown as grey lines) is visualized in a six-frame translation mode. Numbers given between the grey lines indicate the genome coordinates. On top of the forward strand are three reading frames and on the reverse DNA strand are three further reading frames. Each reading frame represented is visible by the indicated stop codons (vertical black bars). Annotated genes are shown in their respective reading frame (turquoise arrows) and also on the DNA strand itself (white arrows). The gene name is written below each arrow. Any protein-coding ORF must be at least located between two black bars, with the downstream stop codon being the translational stop. In the upper part of the panels, the DNA is indicated by a thin black line and the sequencing reads matching to the forward or reverse strand are shown above or below this line. The sequencing reads from the footprint (yellow) and transcriptome (blue) sequencing are shown as filled coverage plots, respectively. The known ncRNAs are indicated on the DNA by a bright green arrow. Since ncRNAs supposedly do not contain a protein-coding ORF, these genes are only shown on the DNA. a csrB: Very few footprint reads are seen for CsrB, indicating that this ncRNA is not translated. b arcZ: In contrast, ArcZ is covered with many footprints and a number of transcript reads are found. All further examples are shown in Additional file 9: Figure S2
Fig. 5
Fig. 5
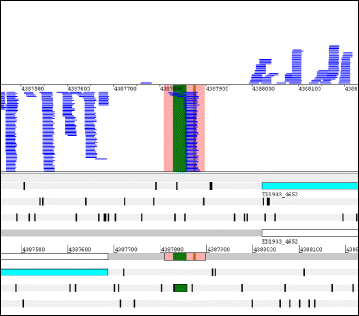
Visualization of individual ribosomal footprints mapping to rhyB. The genomic area is visualized in Artemis 15.0.0 [43]. In the lower part of the panels, the genome (shown as grey lines) is visualized in a six-frame translation mode. Numbers given between the grey lines indicate the genome coordinates. On top of the forward strand are three reading frames and on the reverse DNA strand are three further reading frames. Each reading frame represented is visible by the indicated stop codons (vertical black bars). Annotated genes are shown in their respective reading frame (turquoise arrows) and also on the DNA strand itself (white arrows). The gene name is written below each arrow. In the upper part of the panels, the DNA is indicated by a thin black line and the footprint reads (blue) matching to the forward or reverse strand are shown above or below this line. The shaded areas indicate ryhB (pink), the coding ORF RyhP (green) and a putative weak Shine-Dalgarno sequence (brown; ggagaa)
Fig. 6
Fig. 6
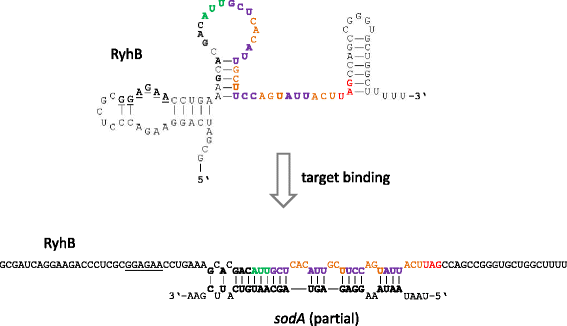
Overview of the secondary structures formed by RyhB for the molecule on its own (top) and after binding to a target RNA, like sodA (bottom). Structures are taken from [99]. Individual bases have been highlighted. Underlined, putative Shine-Dalgarno sequence; green, start codon; violet/orange, individual codons along the frame; red, stop codon, bold; bases involved in hybridization to the sodA-target

Similar articles

Cited by

References

    1. Griffiths-Jones S, Moxon S, Marshall M, Khanna A, Eddy SR, Bateman A. Rfam: annotating non-coding RNAs in complete genomes. Nucleic Acids Res. 2005;33(Database issue):D121–4. doi: 10.1093/nar/gki081. - DOI - PMC - PubMed
    1. Burge SW, Daub J, Eberhardt R, Tate J, Barquist L, Nawrocki EP, Eddy SR, Gardner PP, Bateman A. Rfam 11.0: 10 years of RNA families. Nucleic Acids Res. 2013;41(Database issue):D226–32. doi: 10.1093/nar/gks1005. - DOI - PMC - PubMed
    1. Gottesman S. Micros for microbes: non-coding regulatory RNAs in bacteria. Trends Genet. 2005;21(7):399–404. doi: 10.1016/j.tig.2005.05.008. - DOI - PubMed
    1. Li W, Ying X, Lu Q, Chen L. Predicting sRNAs and their targets in bacteria. Genomics Proteomics Bioinformatics. 2012;10(5):276–84. doi: 10.1016/j.gpb.2012.09.004. - DOI - PMC - PubMed
    1. Georg J, Hess WR. cis-antisense RNA, another level of gene regulation in bacteria. Microbiol. Mol. Biol. Rev. 2011;75(2):286–300. doi: 10.1128/MMBR.00032-10. - DOI - PMC - PubMed

Publication types