

Perspectives on model forecasts of the 2014-2015 Ebola epidemic in West Africa: lessons and the way forward
- PMID: 28245814
- PMCID: PMC5331683
- DOI: 10.1186/s12916-017-0811-y
Perspectives on model forecasts of the 2014-2015 Ebola epidemic in West Africa: lessons and the way forward
Abstract
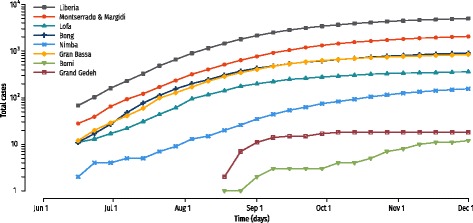
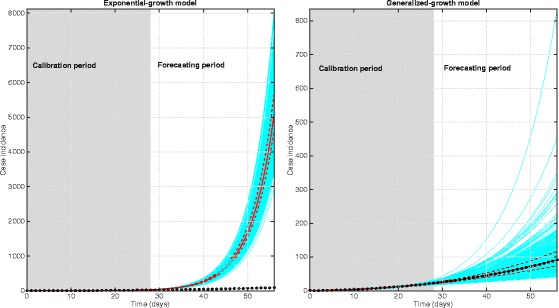
The unprecedented impact and modeling efforts associated with the 2014-2015 Ebola epidemic in West Africa provides a unique opportunity to document the performances and caveats of forecasting approaches used in near-real time for generating evidence and to guide policy. A number of international academic groups have developed and parameterized mathematical models of disease spread to forecast the trajectory of the outbreak. These modeling efforts often relied on limited epidemiological data to derive key transmission and severity parameters, which are needed to calibrate mechanistic models. Here, we provide a perspective on some of the challenges and lessons drawn from these efforts, focusing on (1) data availability and accuracy of early forecasts; (2) the ability of different models to capture the profile of early growth dynamics in local outbreaks and the importance of reactive behavior changes and case clustering; (3) challenges in forecasting the long-term epidemic impact very early in the outbreak; and (4) ways to move forward. We conclude that rapid availability of aggregated population-level data and detailed information on a subset of transmission chains is crucial to characterize transmission patterns, while ensemble-forecasting approaches could limit the uncertainty of any individual model. We believe that coordinated forecasting efforts, combined with rapid dissemination of disease predictions and underlying epidemiological data in shared online platforms, will be critical in optimizing the response to current and future infectious disease emergencies.
Keywords: Data sharing; Disease forecast; Ebola; Epidemic model; Exponential growth; Lessons learned; Polynomial growth; Sub-exponential growth; West Africa.
Figures
Similar articles
-
A novel sub-epidemic modeling framework for short-term forecasting epidemic waves.BMC Med. 2019 Aug 22;17(1):164. doi: 10.1186/s12916-019-1406-6. BMC Med. 2019. PMID: 31438953 Free PMC article.
-
Forecasting the 2014 West African Ebola Outbreak.Epidemiol Rev. 2019 Jan 31;41(1):34-50. doi: 10.1093/epirev/mxz013. Epidemiol Rev. 2019. PMID: 31781750
-
The Ebola outbreak, 2013-2016: old lessons for new epidemics.Philos Trans R Soc Lond B Biol Sci. 2017 May 26;372(1721):20160297. doi: 10.1098/rstb.2016.0297. Philos Trans R Soc Lond B Biol Sci. 2017. PMID: 28396469 Free PMC article. Review.
-
Assessing the performance of real-time epidemic forecasts: A case study of Ebola in the Western Area region of Sierra Leone, 2014-15.PLoS Comput Biol. 2019 Feb 11;15(2):e1006785. doi: 10.1371/journal.pcbi.1006785. eCollection 2019 Feb. PLoS Comput Biol. 2019. PMID: 30742608 Free PMC article.
-
Using phenomenological models for forecasting the 2015 Ebola challenge.Epidemics. 2018 Mar;22:62-70. doi: 10.1016/j.epidem.2016.11.002. Epub 2016 Nov 19. Epidemics. 2018. PMID: 27913131
Cited by
-
Collaborative efforts to forecast seasonal influenza in the United States, 2015-2016.Sci Rep. 2019 Jan 24;9(1):683. doi: 10.1038/s41598-018-36361-9. Sci Rep. 2019. PMID: 30679458 Free PMC article.
-
Assessing parameter identifiability in compartmental dynamic models using a computational approach: application to infectious disease transmission models.Theor Biol Med Model. 2019 Jan 14;16(1):1. doi: 10.1186/s12976-018-0097-6. Theor Biol Med Model. 2019. PMID: 30642334 Free PMC article.
-
Surveillance data confirm multiyear predictions of rotavirus dynamics in New York City.Sci Adv. 2020 Feb 26;6(9):eaax0586. doi: 10.1126/sciadv.aax0586. eCollection 2020 Feb. Sci Adv. 2020. PMID: 32133392 Free PMC article.
-
On the predictability of infectious disease outbreaks.Nat Commun. 2019 Feb 22;10(1):898. doi: 10.1038/s41467-019-08616-0. Nat Commun. 2019. PMID: 30796206 Free PMC article.
-
Improving early epidemiological assessment of emerging Aedes-transmitted epidemics using historical data.PLoS Negl Trop Dis. 2018 Jun 4;12(6):e0006526. doi: 10.1371/journal.pntd.0006526. eCollection 2018 Jun. PLoS Negl Trop Dis. 2018. PMID: 29864129 Free PMC article.
References
-
- Kucharski A, Piot P. Containing Ebola virus infection in West Africa. Euro Surveill. 2014;19(36):20899. - PubMed
-
- World Health Organization. Ebola data and statistics. Ebola Situation Report – 30 March 2016. http://apps.who.int/gho/data/node.ebola-sitrep.ebola-country?lang=en. Accessed 1 June 2016.
Publication types
MeSH terms
Grants and funding
LinkOut - more resources
Full Text Sources
Other Literature Sources
Medical
