

Prognostic stratification improvement by integrating ID1/ID3/IGJ gene expression signature and immunophenotypic profile in adult patients with B-ALL
- PMID: 28245840
- PMCID: PMC5331651
- DOI: 10.1186/s13046-017-0506-4
Prognostic stratification improvement by integrating ID1/ID3/IGJ gene expression signature and immunophenotypic profile in adult patients with B-ALL
Abstract
Background: Survival of adults with B-Acute Lymphoblastic Leukemia requires accurate risk stratification of patients in order to provide the appropriate therapy. Contemporary techniques, using clinical and cytogenetic variables are incomplete for prognosis prediction.
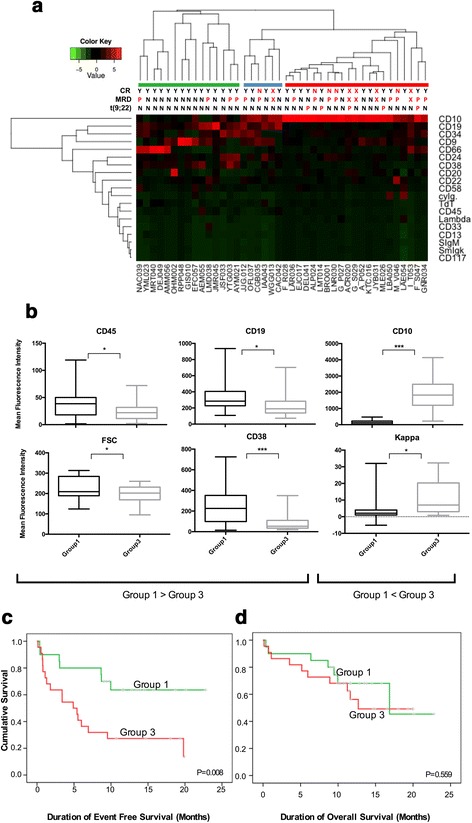
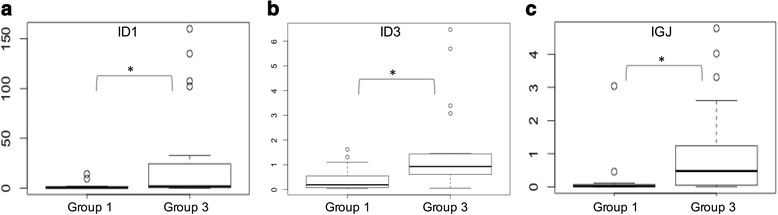
Methods: To improve the classification of adult patients diagnosed with B-ALL into prognosis groups, two strategies were examined and combined: the expression of the ID1/ID3/IGJ gene signature by RT-PCR and the immunophenotypic profile of 19 markers proposed in the EuroFlow protocol by Flow Cytometry in bone marrow samples.
Results: Both techniques were correlated to stratify patients into prognostic groups. An inverse relationship between survival and expression of the three-genes signature was observed and an immunophenotypic profile associated with clinical outcome was identified. Markers CD10 and CD20 were correlated with simultaneous overexpression of ID1, ID3 and IGJ. Patients with simultaneous expression of the poor prognosis gene signature and overexpression of CD10 or CD20, had worse Event Free Survival and Overall Survival than patients who had either the poor prognosis gene expression signature or only CD20 or CD10 overexpressed.
Conclusion: By utilizing the combined evaluation of these two immunophenotypic markers along with the poor prognosis gene expression signature, the risk stratification can be significantly strengthened. Further studies including a large number of patients are needed to confirm these findings.
Keywords: B-ALL; Gene-expression; Immunophenotype; Risk-stratification; Survival.
Figures


Similar articles
-
ID1 and ID3 functions in the modulation of the tumour immune microenvironment in adult patients with B-cell acute lymphoblastic leukaemia.Front Immunol. 2024 Nov 29;15:1473909. doi: 10.3389/fimmu.2024.1473909. eCollection 2024. Front Immunol. 2024. PMID: 39676870 Free PMC article.
-
High expression of ID family and IGJ genes signature as predictor of low induction treatment response and worst survival in adult Hispanic patients with B-acute lymphoblastic leukemia.J Exp Clin Cancer Res. 2016 Apr 5;35:64. doi: 10.1186/s13046-016-0333-z. J Exp Clin Cancer Res. 2016. PMID: 27044543 Free PMC article.
-
Id1 and Id3 co-expression correlates with clinical outcome in stage III-N2 non-small cell lung cancer patients treated with definitive chemoradiotherapy.J Transl Med. 2013 Jan 11;11:13. doi: 10.1186/1479-5876-11-13. J Transl Med. 2013. PMID: 23311395 Free PMC article.
-
Targeting Id1 and Id3 by a specific peptide aptamer induces E-box promoter activity, cell cycle arrest, and apoptosis in breast cancer cells.Breast Cancer Res Treat. 2010 Dec;124(3):623-33. doi: 10.1007/s10549-010-0810-6. Epub 2010 Feb 27. Breast Cancer Res Treat. 2010. PMID: 20191379
-
Lymphoblastic lymphoma.Crit Rev Oncol Hematol. 2011 Sep;79(3):330-43. doi: 10.1016/j.critrevonc.2010.12.003. Epub 2011 Jan 26. Crit Rev Oncol Hematol. 2011. PMID: 21273093 Review.
Cited by
-
Combination of the PI3K inhibitor Idelalisib with the conventional cytostatics cytarabine and dexamethasone leads to changes in pathway activation that induce anti-proliferative effects in B lymphoblastic leukaemia cell lines.Cancer Cell Int. 2020 Aug 12;20:390. doi: 10.1186/s12935-020-01431-4. eCollection 2020. Cancer Cell Int. 2020. PMID: 32817744 Free PMC article.
-
Genetic Profiling in Children With Acute Lymphoblastic Leukemia Referred for Allogeneic Hematopoietic Stem Cell Transplantation.Cancer Control. 2022 Jan-Dec;29:10732748211064776. doi: 10.1177/10732748211064776. Cancer Control. 2022. PMID: 35470705 Free PMC article.
-
ID1 and ID3 functions in the modulation of the tumour immune microenvironment in adult patients with B-cell acute lymphoblastic leukaemia.Front Immunol. 2024 Nov 29;15:1473909. doi: 10.3389/fimmu.2024.1473909. eCollection 2024. Front Immunol. 2024. PMID: 39676870 Free PMC article.
-
Novel gene signature reveals prognostic model in acute lymphoblastic leukemia.Front Cell Dev Biol. 2022 Nov 3;10:1036312. doi: 10.3389/fcell.2022.1036312. eCollection 2022. Front Cell Dev Biol. 2022. PMID: 36407095 Free PMC article.
-
Paradoxical role of Id proteins in regulating tumorigenic potential of lymphoid cells.Front Med. 2018 Aug;12(4):374-386. doi: 10.1007/s11684-018-0652-x. Epub 2018 Jul 24. Front Med. 2018. PMID: 30043222 Review.
References
-
- Sayehmiri K, Eshraghian MR, Mohammad K, Alimoghaddam K, Foroushani A, Zeraati H, et al. Prognostic factors of survival time after hematopoietic stem cell transplant in acute lymphoblastic leukemia patients: cox proportional hazard versus accelerated failure time models. J Exp Clin Cancer Res. 2008;27(1):74. doi: 10.1186/1756-9966-27-74. - DOI - PMC - PubMed
-
- Okamoto R, Ogawa S, Nowak D, Kawamata N, Akagi T, Kato M, et al. Genomic profiling of adult acute lymphoblastic leukemia by single nucleotide polymorphism oligonucleotide microarray and comparison to pediatric acute lymphoblastic leukemia. Haematologica. 2010;95(9):1481–1488. doi: 10.3324/haematol.2009.011114. - DOI - PMC - PubMed
Publication types
MeSH terms
Substances
LinkOut - more resources
Full Text Sources
Other Literature Sources
Molecular Biology Databases
