Adaptive multiscapes: an up-to-date metaphor to visualize molecular adaptation
- PMID: 28245845
- PMCID: PMC5331743
- DOI: 10.1186/s13062-017-0178-1
Adaptive multiscapes: an up-to-date metaphor to visualize molecular adaptation
Abstract
Background: Wright's metaphor of the fitness landscape has shaped and conditioned our view of the adaptation of populations for almost a century. Since its inception, and including criticism raised by Wright himself, the concept has been surrounded by controversy. Among others, the debate stems from the intrinsic difficulty to capture important features of the space of genotypes, such as its high dimensionality or the existence of abundant ridges, in a visually appealing two-dimensional picture. Two additional currently widespread observations come to further constrain the applicability of the original metaphor: the very skewed distribution of phenotype sizes (which may actively prevent, due to entropic effects, the achievement of fitness maxima), and functional promiscuity (i.e. the existence of secondary functions which entail partial adaptation to environments never encountered before by the population).
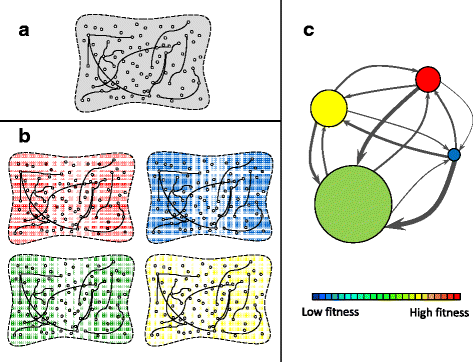
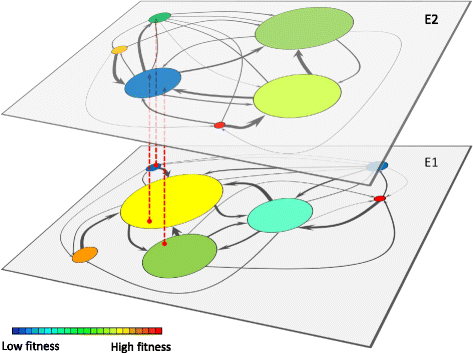
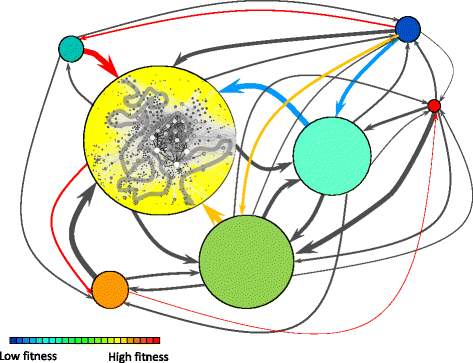
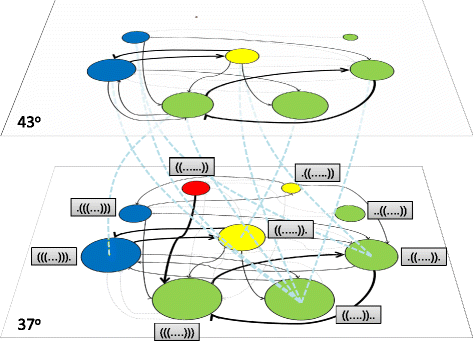
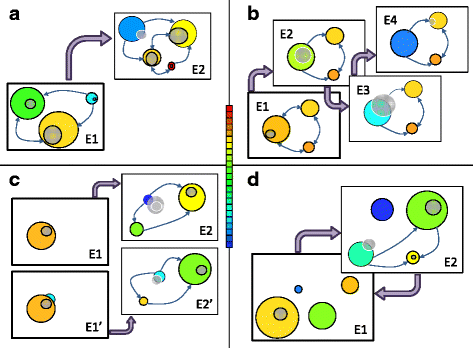
Results: Here we revise some of the shortcomings of the fitness landscape metaphor and propose a new "scape" formed by interconnected layers, each layer containing the phenotypes viable in a given environment. Different phenotypes within a layer are accessible through mutations with selective value, while neutral mutations cause displacements of populations within a phenotype. A different environment is represented as a separated layer, where phenotypes may have new fitness values, other phenotypes may be viable, and the same genotype may yield a different phenotype, representing genotypic promiscuity. This scenario explicitly includes the many-to-many structure of the genotype-to-phenotype map. A number of empirical observations regarding the adaptation of populations in the light of adaptive multiscapes are reviewed.
Conclusions: Several shortcomings of Wright's visualization of fitness landscapes can be overcome through adaptive multiscapes. Relevant aspects of population adaptation, such as neutral drift, functional promiscuity or environment-dependent fitness, as well as entropic trapping and the concomitant impossibility to reach fitness peaks are visualized at once. Adaptive multiscapes should aid in the qualitative understanding of the multiple pathways involved in evolutionary dynamics.
Reviewers: This article was reviewed by Eugene Koonin and Ricard Solé.
Keywords: Adaptive landscape; Environment; Functional promiscuity; Genotype-phenotype map; Neutral networks; Phenotype size.
Figures
Similar articles
-
On the networked architecture of genotype spaces and its critical effects on molecular evolution.Open Biol. 2018 Jul;8(7):180069. doi: 10.1098/rsob.180069. Open Biol. 2018. PMID: 29973397 Free PMC article. Review.
-
Hybridization alters the shape of the genotypic fitness landscape, increasing access to novel fitness peaks during adaptive radiation.Elife. 2022 May 26;11:e72905. doi: 10.7554/eLife.72905. Elife. 2022. PMID: 35616528 Free PMC article.
-
Reconstructing the genotype-to-fitness map for the bacterial chemotaxis network and its emergent behavioural phenotypes.J Theor Biol. 2017 May 7;420:200-212. doi: 10.1016/j.jtbi.2017.03.016. Epub 2017 Mar 18. J Theor Biol. 2017. PMID: 28322874
-
Adaptive evolutionary walks require neutral intermediates in RNA fitness landscapes.Theor Popul Biol. 2011 Feb-Mar;79(1-2):12-8. doi: 10.1016/j.tpb.2010.10.001. Epub 2010 Oct 16. Theor Popul Biol. 2011. PMID: 20937293
-
Evolution in the light of fitness landscape theory.Trends Ecol Evol. 2019 Jan;34(1):69-82. doi: 10.1016/j.tree.2018.10.009. Epub 2018 Dec 21. Trends Ecol Evol. 2019. PMID: 30583805 Review.
Cited by
-
Distribution of genotype network sizes in sequence-to-structure genotype-phenotype maps.J R Soc Interface. 2017 Apr;14(129):20160976. doi: 10.1098/rsif.2016.0976. J R Soc Interface. 2017. PMID: 28424303 Free PMC article.
-
Differences in adaptive dynamics determine the success of virus variants that propagate together.Virus Evol. 2018 Jan 9;4(1):vex043. doi: 10.1093/ve/vex043. eCollection 2018 Jan. Virus Evol. 2018. PMID: 29340211 Free PMC article.
-
Fundamental constraints to the logic of living systems.Interface Focus. 2024 Oct 25;14(5):20240010. doi: 10.1098/rsfs.2024.0010. eCollection 2024 Oct 11. Interface Focus. 2024. PMID: 39464646 Free PMC article. Review.
-
The two languages of science.Genome Biol. 2020 Jun 17;21(1):147. doi: 10.1186/s13059-020-02057-5. Genome Biol. 2020. PMID: 32552854 Free PMC article. No abstract available.
-
On the networked architecture of genotype spaces and its critical effects on molecular evolution.Open Biol. 2018 Jul;8(7):180069. doi: 10.1098/rsob.180069. Open Biol. 2018. PMID: 29973397 Free PMC article. Review.
References
-
- Pigliucci M. Sewall Wright’s adaptive landscapes: 1932 vs. 1988. Biol Philos. 2008;23:591–603. doi: 10.1007/s10539-008-9124-z. - DOI
-
- Svensson EI, Calsbeek R. The Adaptive Landscape in Evolutionary Biology. Oxford: Oxford University Press; 2012.
-
- Wright S. The roles of mutation, inbreeding, crossbreeding and selection in evolution. Proc 6th Int Congr Genet. 1932;1:356–66.
Publication types
MeSH terms
LinkOut - more resources
Full Text Sources
Other Literature Sources

