. 2017 May 5;292(18):7304-7313.
doi: 10.1074/jbc.M116.770149. Epub 2017 Feb 28.

A mammalian homolog of the zebrafish transmembrane protein 2 (TMEM2) is the long-sought-after cell-surface hyaluronidase

Affiliations

A mammalian homolog of the zebrafish transmembrane protein 2 (TMEM2) is the long-sought-after cell-surface hyaluronidase

Hayato Yamamoto et al. J Biol Chem. .

Abstract

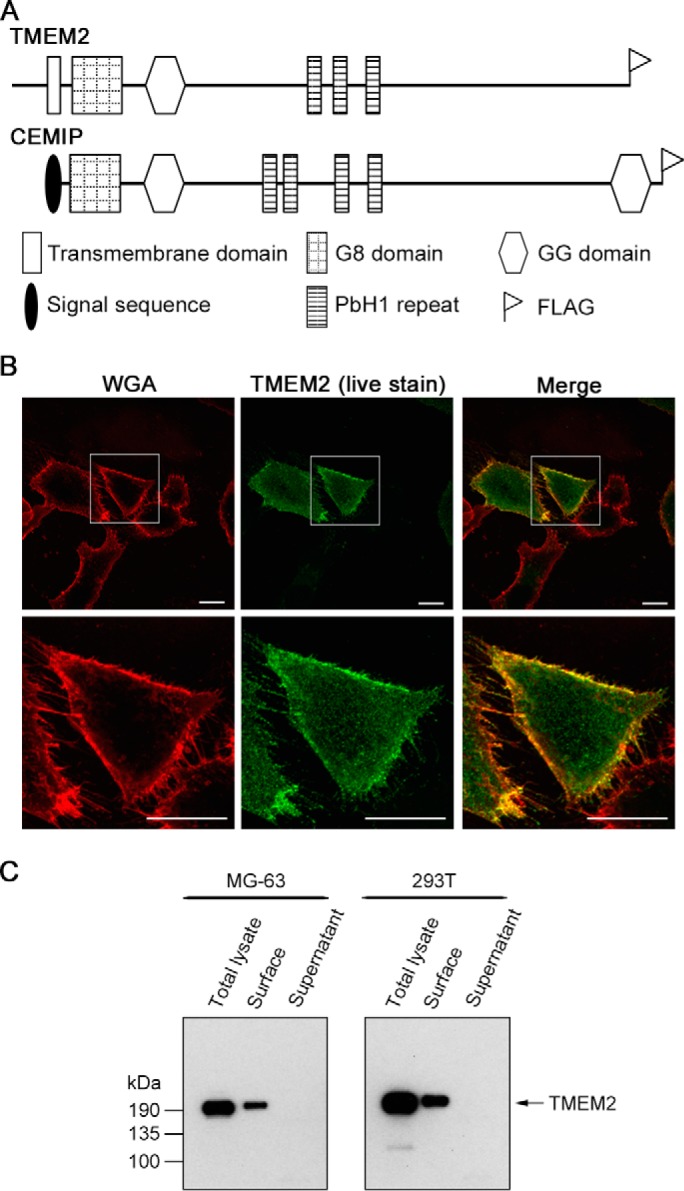
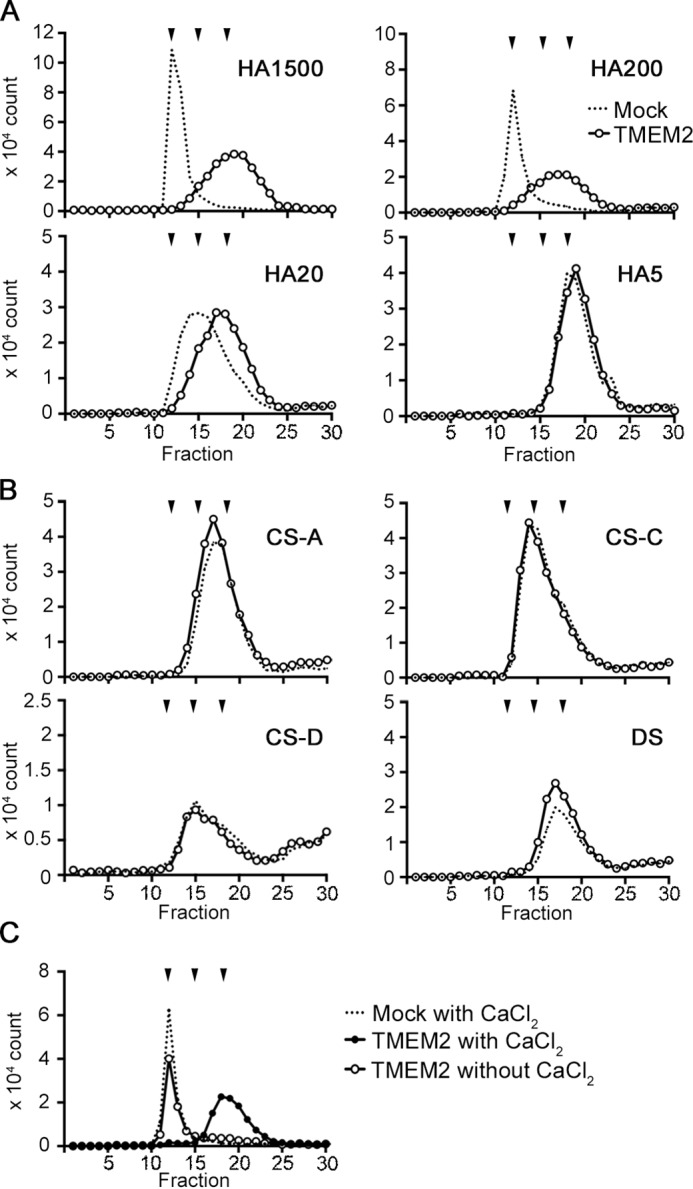
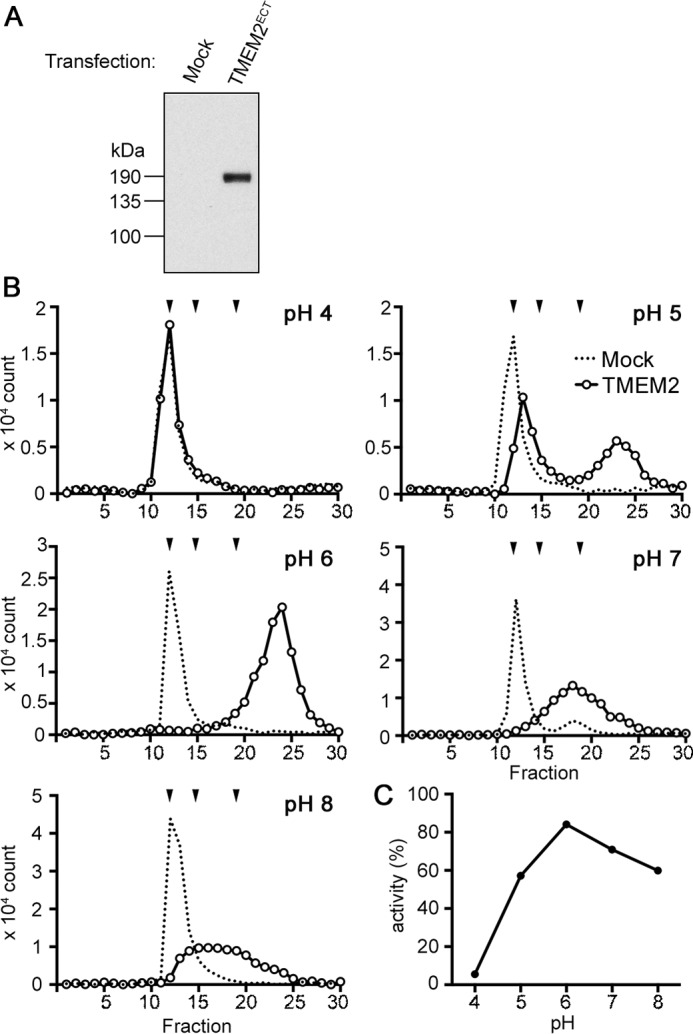
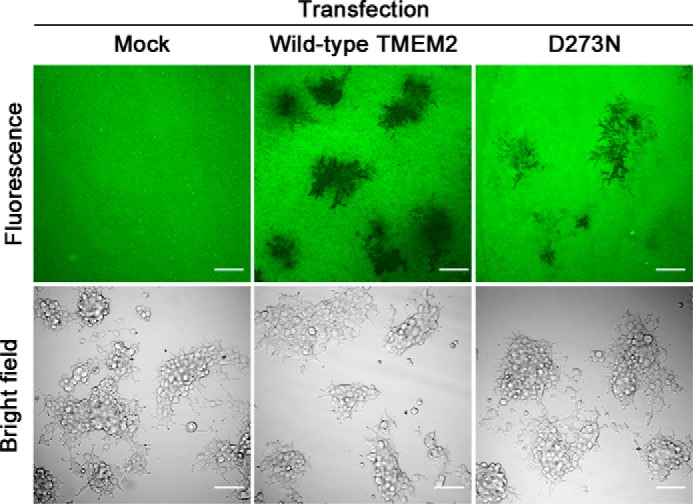
Hyaluronan (HA) is an extremely large polysaccharide (glycosaminoglycan) involved in many cellular functions. HA catabolism is thought to involve the initial cleavage of extracellular high-molecular-weight (HMW) HA into intermediate-size HA by an extracellular or cell-surface hyaluronidase, internalization of intermediate-size HA, and complete degradation into monosaccharides in lysosomes. Despite considerable research, the identity of the hyaluronidase responsible for the initial HA cleavage in the extracellular space remains elusive. HYAL1 and HYAL2 have properties more consistent with lysosomal hyaluronidases, whereas CEMIP/KIAA1199, a recently identified HA-binding molecule that has HA-degrading activity, requires the participation of the clathrin-coated pit pathway of live cells for HA degradation. Here we show that transmembrane protein 2 (TMEM2), a mammalian homolog of a protein playing a role in zebrafish endocardial cushion development, is a cell-surface hyaluronidase. Live immunostaining and surface biotinylation assays confirmed that mouse TMEM2 is expressed on the cell surface in a type II transmembrane topology. TMEM2 degraded HMW-HA into ∼5-kDa fragments but did not cleave chondroitin sulfate or dermatan sulfate, indicating its specificity to HA. The hyaluronidase activity of TMEM2 was Ca2+-dependent; the enzyme's pH optimum is around 6-7, and unlike CEMIP/KIAA1199, TMEM2 does not require the participation of live cells for its hyaluronidase activity. Moreover, TMEM2-expressing cells could eliminate HA immobilized on a glass surface in a contact-dependent manner. Together, these data suggest that TMEM2 is the long-sought-after hyaluronidase that cleaves extracellular HMW-HA into intermediate-size fragments before internalization and degradation in the lysosome.

Keywords: CEMIP/KIAA1199; TMEM2; cell surface; glycosaminoglycan; hyaluronan; hyaluronidase; membrane function.


Conflict of interest statement

The authors declare that they have no conflicts of interest with the contents of this article

Figures

Figure 1.
Figure 1.
TMEM2 is expressed as a type II transmembrane protein. A, domain structure of TMEM2 and CEMIP. The location of the FLAG epitope tag added to recombinant proteins is also indicated. B, live immunostaining of MG-63 cells transiently transfected with TMEM2WT. Cells were stained live with anti-FLAG antibody to detect surface-expressed TMEM2. Co-staining with Alexa Fluor 594-conjugated wheat germ agglutinin reagent (WGA) was used to visualize cell contours. Scale bars, 10 μm. The experiment was repeated three times with similar results. C, analysis of cell surface expression by surface biotinylation assays. Cells were transfected with TMEM2WT. Forty eight h after transfection, culture supernatants were harvested (Supernatant). Cells were then incubated with membrane-impermeable sulfo-NHS-SS-biotin and solubilized with RIPA buffer (Total lysate). Biotinylated proteins were isolated from total lysates with streptavidin-agarose (Surface). Equivalent amounts of these fractions were analyzed by immunoblotting with anti-FLAG M2 antibody. The experiment was repeated two times with similar results.
Figure 2.
Figure 2.
HA-specific degrading activity of TMEM2 and its Ca2+ dependence. A and B, 293T cells were transiently transfected with TMEM2WT (TMEM2) or without cDNA (Mock) and cultured with 0.1 μg/ml of FA-labeled GAGs to examine GAG-degrading activity of TMEM2. Degradation of GAGs was analyzed by gel filtration on a Sephacryl S-300HR column. A, degradation of HA of different average sizes (FA-HA1500, FA-HA200, FA-HA20, and FA-HA5). The experiment was repeated three times with similar results. B, degradation of chondroitin sulfate A (FA-CSA), B (FA-CSC), D (FA-CSD), and dermatan sulfate (DS). The experiment was repeated two times with similar results. C, effect of Ca2+ on the HA-degrading activity of TMEM2. HA degradation assay was performed with membrane fraction of TMEM2WT-transfected 293T cells and FA-HA1500 in the presence and absence of 1 mm CaCl2. A–C, downward arrowheads above the chromatograms represent, from left to right, elution peaks of FA-HA1500/FA-HA200 (both are eluted at V0), FA-HA20, and FA-HA5, respectively. The experiment was repeated three times with similar results.
Figure 3.
Figure 3.
Identification of amino acid residues critical for the hyaluronidase activity of TMEM2. A, sequence alignment of human, mouse, and zebrafish TMEM2 and human and mouse CEMIP in the region surrounding the deafness mutation site (Arg187) of CEMIP. Shaded residues in TMEM2 were mutagenized as follows: R265C, D273N, D275N, D286N, E260N/D262Q, and E281Q/E283Q. B, analysis of the expression level of TMEM2 point mutants in 293T cells. Total cell lysates of transfected 293T cells were analyzed by immunoblotting with anti-FLAG M2 (upper panel) and anti-α-tubulin antibodies (lower panel; loading controls). C, HA-degrading activity of TMEM2 mutants. HA degradation assays with 293T cells were performed with TMEM2 mutants as indicated in the panels. The experiment with D273N and D275N was performed as a single experiment with a single mock sample, and gel filtration chromatography was run consecutively; therefore, the trace of the mock sample was reused in these two panels. The same is true for the experiment with E260N/D262Q and E281Q/E283Q. Downward arrowheads above the chromatograms represent, from left to right, elution peaks of FA-HA1500/FA-HA200 (both are eluted at V0), FA-HA20, and FA-HA5, respectively. Each experiment was repeated three times with similar results.
Figure 4.
Figure 4.
Effect of pH on the hyaluronidase activity of TMEM2. A, analysis of the expression of soluble TMEM2. 293T cells were transfected with an N-terminally truncated TMEM2 cDNA (TMEM2ECT) or without cDNA (Mock), and culture supernatants were immunoblotted with rabbit polyclonal anti-TMEM2 antibody. B, HA-degrading activity of soluble TMEM2 at different pH conditions. FA-HA1500 (0.06 μg/ml) was incubated for 16 h with concentrated culture supernatants from TMEM2ECT-transfected or mock-transfected 293T cells in reaction buffers adjusted to pH 4–8 as indicated in the figure. Degradation of HA was analyzed by gel filtration on Sephacryl S-300 HR. Downward arrowheads above the chromatograms represent, from left to right, elution peaks of FA-HA1500/FA-HA200 (both are eluted at V0), FA-HA20, and FA-HA5, respectively. The experiment was repeated two times with similar results. C, pH profile of the hyaluronidase activity of soluble TMEM2. Enzyme activity is expressed as a percentage of fluorescence counts that represent depolymerized HA relative to the total fluorescence input.
Figure 5.
Figure 5.
TMEM2-expressing cells degrade substrate-bound HA in a contact-dependent manner. 293T cells transfected with TMEM2WT (WT), D273N (D273N), or without cDNA (Mock) were plated on a substrate of FA-HA1500 immobilized to amino-silanized glass. After incubating for 60 h, cultures were examined on a confocal microscope with both fluorescence imaging (top panels) and bright field imaging (bottom panels). Note that TMEM2-expressing cells eliminate substrate-bound HA corresponding to the location of cell clusters. Scale bar, 100 μm. The experiment was repeated four times with similar results.
Figure 6.
Figure 6.
Expression profiles of Tmem2 and Cemip in normal mouse tissues (A) and during embryonic development (B) determined by absolute quantification by RT-qPCR. Copy numbers of Tmem2 and Cemip transcripts were determined by TaqMan gene expression assay with standard curves generated from reference plasmids. All samples were analyzed in biological triplicates. Filled circles, Tmem2; open triangles, Cemip.

Similar articles

Cited by

References

    1. Laurent T. C., and Fraser J. R. (1992) Hyaluronan. FASEB J. 6, 2397–2404 - PubMed
    1. Fraser J. R., and Laurent T. C. (1989) Turnover and metabolism of hyaluronan. Ciba Found. Symp. 143, 41–53 - PubMed
    1. Stern R. (2003) Devising a pathway for hyaluronan catabolism: are we there yet? Glycobiology 13, 105R–115R - PubMed
    1. Stern R., Kogan G., Jedrzejas M. J., and Soltés L. (2007) The many ways to cleave hyaluronan. Biotechnol. Adv. 25, 537–557 - PubMed
    1. Chanmee T., Ontong P., and Itano N. (2016) Hyaluronan: A modulator of the tumor microenvironment. Cancer Lett. 375, 20–30 - PubMed

Publication types