Review
. 2017 Jul 5;9(7):a023887.
doi: 10.1101/cshperspect.a023887.

Synthetic Botany

Affiliations
Review

Synthetic Botany

Christian R Boehm et al. Cold Spring Harb Perspect Biol. .

Abstract

Plants are attractive platforms for synthetic biology and metabolic engineering. Plants' modular and plastic body plans, capacity for photosynthesis, extensive secondary metabolism, and agronomic systems for large-scale production make them ideal targets for genetic reprogramming. However, efforts in this area have been constrained by slow growth, long life cycles, the requirement for specialized facilities, a paucity of efficient tools for genetic manipulation, and the complexity of multicellularity. There is a need for better experimental and theoretical frameworks to understand the way genetic networks, cellular populations, and tissue-wide physical processes interact at different scales. We highlight new approaches to the DNA-based manipulation of plants and the use of advanced quantitative imaging techniques in simple plant models such as Marchantia polymorpha. These offer the prospects of improved understanding of plant dynamics and new approaches to rational engineering of plant traits.


Figures

Figure 1.
Figure 1.
Summary of the Phytobrick syntax for standardized plant DNA part composition and assembly. The Phytobrick syntax is a consolidation of Golden Gate, MoClo, and Golden Braid standards (Patron et al. 2015) and defines 12 fusion sites that divide eukaryotic genes into 10 basic functional units (A1–C1). The domains are listed with a brief description of their encoded function. Phytobrick parts can comprise the region between an adjacent pair of fusion sites or span many sites, and consist of portion(s) of a gene cloned into a plasmid flanked by a convergent pair of BsaI Type IIS restriction endonuclease recognition sequences. Parts can be assembled into complete transcriptional units in a one-pot, one-step digestion–ligation reaction provided compatible overhangs are produced on digestion and the acceptor plasmid has divergent BsaI recognition sites as well as a unique bacterial selection cassette.
Figure 2.
Figure 2.
Spore germination. Marchantia spores were germinated on a nutrient agar surface. The spores were examined under a 63×, NA 1.2 objective at 0, 24, 48, 72, and 96 h after germination using a Leica SP5 confocal laser scanning microscope. A 488-nm laser was used to collect transmission images (grayscale channel), and these were overlaid with images of chlorophyll fluorescence (488 nm excitation, 680–700 nm emission, red channel). Z-series of images (2 µm apart) were collected and merged to provide views of the developing sporelings at different stages of growth. Scale bars are indicated in each image.
Figure 3.
Figure 3.
Transgenic chloroplasts of Marchantia polymorpha expressing the cyan fluorescent protein mTurquoise2 under control of the tobacco psbA promoter. Mature thallus of Marchantia was mounted in water under a coverslip, and examined under a 63×, NA 1.2 objective using a Leica SP5 confocal laser-scanning microscope. Cells surrounding an air pore were imaged using 458-nm laser excitation. Emission wavelengths were collected for chloroplast autofluorescence (610–700 nm, left) and cyan fluorescent protein (CFP) fluorescence (466–495 nm, right), with merged images in red and green channels, respectively, shown center. Scale bar, 20 µm.
Figure 4.
Figure 4.
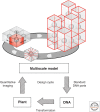
Multiscale model of plant growth for engineering synthetic botanical forms. To model and predict the form of reprogrammed plants, integrated, multiscale models for plant growth are required. These software models need to capture (1) the interaction between cytoskeletal elements and local cell wall determinants, strain or geometry regulating the polarity of cell division and elongation, (2) genetic interactions between neighboring cells that can trigger gene expression and cell proliferation and differentiation, and (3) cellular growth that results in physical strains that are transmitted across tissues and constrain cell growth, because physical constraints on cell size and shape regulate timing and orientation of individual cell divisions and guide morphogenesis. Multiscale models provide an essential tool for engineering multicellular systems. Standardized DNA parts facilitate assembly of DNA circuits that may be introduced into plant systems by transformation, and the performance of DNA-based circuits can be measured using quantitative imaging techniques. Although a genetic circuit may regulate or alter the behavior of an individual cell in an easily predictable fashion, the consequences of altered cell interactions, propagation of changes across large cell populations, changes in tissue-wide physical and chemical interactions, and feedback on the properties of individual cells are difficult to predict. However, this type of system, characterized by cross talk and emergent properties, can be captured accurately by multiscale models. The models form an essential part of any design–build–test cycle for DNA-based engineering of plants.
Figure 5.
Figure 5.
Marchantia gemmae as testbeds for quantitative parameterization of plant growth. (A) A transgenic line of Marchantia was generated that expressed a green fluorescent protein localized to the plasma membrane. A gemma from this transgenic line was transferred to a nutrient agar surface and examined after 12, 24, 36, 48, and 60 h of growth using a Leica SP5 confocal laser scanning microscope. Z-series of optical sections were collected for the same gemma, and maximum intensity projections are shown for each point during growth. Scale bar, 500 µm. (B) The 24-h (green channel) and 36-h (red channel) images from the time course were matched using warp-registration image-processing techniques and overlaid. A white box is positioned over one of the apical notches, and this corresponds to the enlarged view shown in the inset. The frequency and orientation of apex-localized cell divisions can be directly visualized in a single gemma. Scale bar, 200 µm. (C) The plasma membrane-localized marker allows accurate segmentation of cell geometry during growth of living plants. Quantitative parameters such as cell expansion rate can be mapped across a single gemma. Measurements of percent clonal sector expansion per 12 h are shown as a color map. Scale bar, 200 µm.

Similar articles

Cited by

References

    1. Adachi T, Takase H, Tomizawa K. 2007. Introduction of a 50 kbp DNA fragment into the plastid genome. Biosci Biotechnol Biochem 71: 2266–2273. - PubMed
    1. Annaluru N, Muller H, Mitchell LA, Ramalingam S, Stracquadanio G, Richardson SM, Dymond JS, Kuang Z, Scheifele LZ, Cooper EM, et al. 2014. Total synthesis of a functional designer eukaryotic chromosome. Science 344: 55–58. - PMC - PubMed
    1. Anthony PC, Perez CF, Garcia-Garcia C, Block SM. 2012. Folding energy landscape of the thiamine pyrophosphate riboswitch aptamer. Proc Natl Acad Sci 109: 1485–1489. - PMC - PubMed
    1. Antunes MS, Morey KJ, Tewari-Singh N, Bowen TA, Smith JJ, Webb CT, Hellinga HW, Medford JI. 2009. Engineering key components in a synthetic eukaryotic signal transduction pathway. Mol Syst Biol 5: 270. - PMC - PubMed
    1. Antunes MS, Morey KJ, Smith JJ, Albrecht KD, Bowen TA, Zdunek JK, Troupe JF, Cuneo MJ, Webb CT, Hellinga HW, et al. 2011. Programmable ligand detection system in plants through a synthetic signal transduction pathway. PLoS ONE 6: e16292. - PMC - PubMed

MeSH terms

LinkOut - more resources